Market Analysis of Gold on Tuesday 14 September 2021
On Monday, Gold rose slightly. US stocks fell back from high position which supports the price of gold. However, the recent gains in the US indices limited the gains in gold prices. The market focus today is on the US Consumer Price Index. Since the epidemic, the Federal Reserve has started printing money and continue to spread money. This has led to inflation and made the risk aversion sentiment by buying gold strengthened. Almost every CPI data released every month states that gold prices are rising, please take trading opportunity from that data.
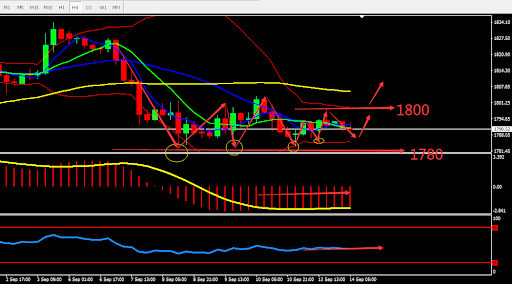
Technically, gold's daily candle has fluctuated for 4 days in a row around the middle BOLL band or 1790. MACD is near the 0 axis and the market is relatively stable. The 4 hours chart shows the gold candle is forming to become an effective support near below 1780. MA converges and RSI is at around 50. Overall, prioritize operation in the fluctuation zone, open positions on a breakout. Consider the support zone and resistance zone, short term intraday trading split the bull bear point around 1800.

Resistance:1795-1800-1810
Support:1785-1780-1770
Market Analysis of Crude Oil on Tuesday 14 September 2021
Crude oil continued to rise on Monday as OPEC forecasts that global fuel use will increase, and US production was interrupted. At present, the crude oil house leaks again while it has been raining every night. Two weeks after Hurricane Ida hit the Gulf Coast, US oil production is still slowly recovering. Further damage from severe weather may be imminent. The National Hurricane Center expects that Tropical Storm Nicholas will make landfall near Corpus Christi, Texas on Monday night, which will further push crude oil price.
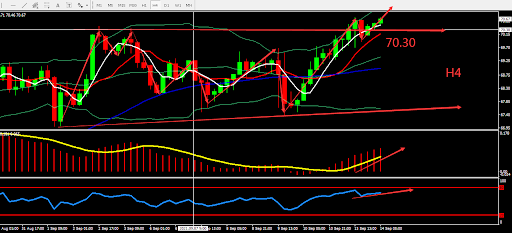
From a technical perspective, the daily graph closed bullish. Crude oil stabilised near MA60 and formed Golden Cross. RSI showed bullish sign. On H4 graph, crude oil has been above the middle Bollinger band for a long time which is a bullish sign. MACD was above the 0 axis and it could diverge. Overall, prioritise Buy at low position. The chart below is showing the key point and the estimated trend, the deciding point whether to buy or sell is near 70.30.

Resistance:71.20-71.70-72.30
Support:70.30-69.70-69.10
This material is from Quant Tech Limited and is being posted with permission from Quant Tech Limited. The views expressed in this material are solely those of the author and/or Quant Tech Limited and BTCDana is not endorsing or recommending any investment or trading discussed in the material. Before acting on this material, you should consider whether it is suitable for your circumstances and as necessary, seek professional advice.


