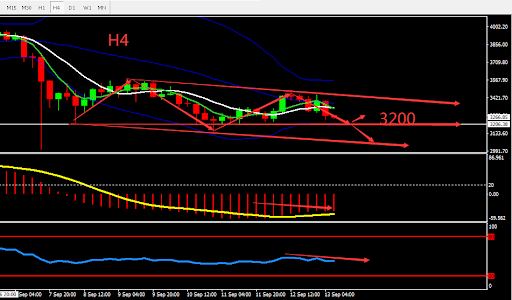
On Monday morning, Ethereum rushed higher and fell back, falling below the important $3300, and is now quoted at $3260. Ethereum's current full network hashrate is 660.14TH/s, the current holding address has increased by 115,097, the 24h chain transaction volume is 1,839,785 ETH, the burning volume is 282,100 ETH, and the average burn value of a single block is 1.4911 ETH. In the past week, 73,900 ETH were destroyed, and over 1 billion USD of ETH were transferred in the past 24 hours.
From a technical point of view, Ethereum’s weekly graph closed with a large bearish candle. Ethereum tried to strengthen but faces resistance. The daily candle closed with a bearish doji candle, indicating that the market lacked confidence to strengthen. H4 graph shows formation of bottom ladder, MA formed Death Cross, and the indicators are bearish across the board. Overall prioritize selling at high prices on the fluctuation zone. Consider the support zone and resistance zone, the deciding point whether to buy or sell is nearnear 3200.

Resistance:3340-3400-3470
Support:3200-3140-3000
This material is from Quant Tech Limited and is being posted with permission from Quant Tech Limited. The views expressed in this material are solely those of the author and/or Quant Tech Limited and BTCDana is not endorsing or recommending any investment or trading discussed in the material. Before acting on this material, you should consider whether it is suitable for your circumstances and as necessary, seek professional advice


