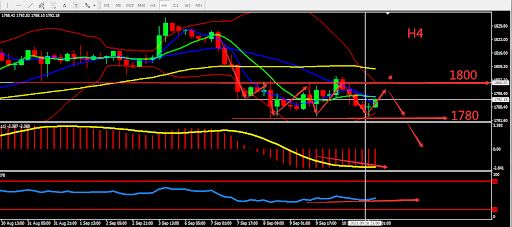
On Monday in the Asian session, the US dollar index continued to rise. Gold is down in the short term, hitting a low of $1,783.68 an ounce. Last week, US President Biden released an updated plan to tackle the COVID-19 epidemic, and the issue of maximizing debt has been in the spotlight again. Fed official Huck gave a hawkish signal in the early market. He asked the Fed to reduce the scale of bond purchases as soon as possible. Influenced by this, the US dollar found support, while gold prices were under resistance.
From a technical perspective, Gold's weekly graph closed with a large bearish candle, forming the Evening Star pattern, which is a clear signal that the market will be bearish. Gold's daily candle strengthened then weakened, falling from above the middle BOLL back below the middle BOLL. The 4 hours chart shows strengthening from bottom positions, indicators remain relatively bearish. Overall, prioritize selling at high prices in the fluctuation zone. Consider the support zone and resistance zone, the deciding point whether to buy or sell is near 1800.

Resistance:1796-1800-1810
Support:1787-1780-1770
Market Analysis of Crude Oil on Monday 13 September 2021
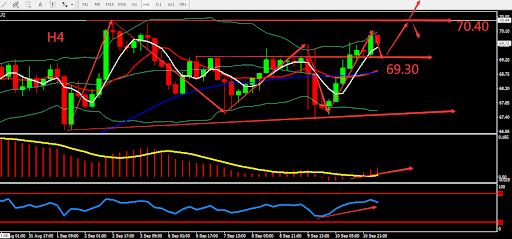
On Monday Asia session, crude oil continued last Friday's upward trend, hitting a weekly high of US$70.10/barrel. There are more and more signs that Hurricane Ida has caused a tight supply in the United States. The call between US and Chinese heads of state have given a boost to higher-risk assets. According to the news, the Organization of the Petroleum Exporting Countries (OPEC) may lower its oil demand growth forecast for 2022 on Monday, because the spread of the Delta new coronavirus variant makes the speed of the recovery of fuel consumption questionable.
From a technical perspective, the weekly graph continued being closed by Doji Star and the market lacks direction. The relative volatility of the daily graph is limited, showing a very small interval. On H4 graph, crude oil continued to close bullish and going upward. MA formed Golden Cross, MACD was above the 0 axis. Overall, crude oil showed strong momentum short-term. Prioritise Buy within the fluctuation zone. The trading refers to the support and resistance levels below. The deciding point whether to buy or sell is near 70.40.

Resistance:70.40-71.00-72.00
Support:69.30-68.70-67.50
This material is from Quant Tech Limited and is being posted with permission from Quant Tech Limited. The views expressed in this material are solely those of the author and/or Quant Tech Limited and BTCDana is not endorsing or recommending any investment or trading discussed in the material. Before acting on this material, you should consider whether it is suitable for your circumstances and as necessary, seek professional advice.


