Market Analysis of Gold on Friday 10 September 2021
On Thursday, as the US dollar weakened slightly, gold prices rose, ending three consecutive trading days of decline. Markets are predicting that the Fed may start easing economic support measures early and a series of data released by major economies has limited the rise in gold prices. The European Central Bank has also slowed bond purchases. Last August, global gold exchange (ETF) outflows reached 22.4 tons or US$1.3 billion. This year, 141 tonnes of gold have flowed out of the ETF market.
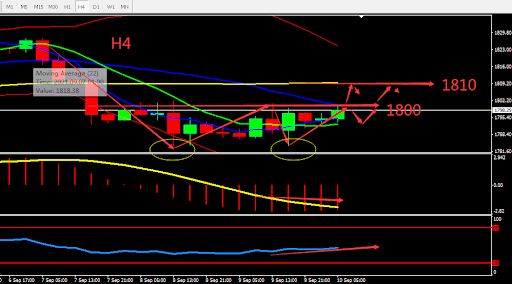
From a technical perspective, gold is sideways yesterday. There is quite clear support near 1780, and the indicators on daily graph tend to be neutral. On the 4-hour chart, gold is strengthening and forming a double bottom pattern. The middle Bollinger band is under pressure at around 1800, and the MA is stable and forming a golden cross at the bottom. Overall prioritize buying at low prices in the fluctuation zone. Consider the support zone and resistance zone, the deciding point whether to buy or sell is near 1800.

Resistance:1800-1810-1820
Support:1792-1786-1780
Market Analysis of Crude Oil on Friday 10 September 2021
On Friday Asia session, crude oil consolidated at around $68.30. On Thursday, it fell more than 2%, recording the biggest one-day drop in two weeks. EIA data shows that as of the week of September 3, crude oil inventories fell by 1.528 million barrels, which was less than the expected 4.75 million barrels. At the same time, as investors sought safer assets, US Treasuries rose, which caused serious panic in the oil market. Earlier, the Organization of Petroleum Exporting Countries and its allies (OPEC+) announced that they would continue to increase production by 400,000 barrels per day as planned.
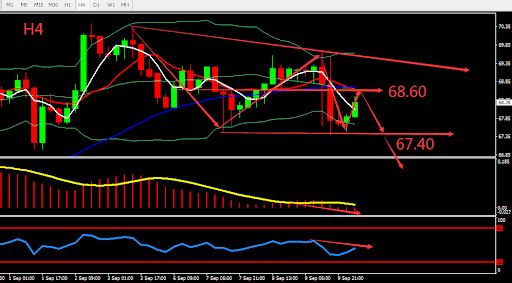
From a technical point of view, the daily graph closed bearish and found support around the middle BOLL band. MA formed Death Cross. On H4 graph shows that oil price was weak and moved around the lower BOLL band. MACD volume is moving downwards, market sentiment was bearish. Overall prioritise Sell within the fluctuation zone. Trading refers to the support and resistance points below. Consider the support zone and resistance zone, the deciding point whether to buy or sell is near 67.40.

Resistance:68.60-69.50-70.40
Support:67.40-67.00-66.00
This material is from Quant Tech Limited and is being posted with permission from Quant Tech Limited. The views expressed in this material are solely those of the author and/or Quant Tech Limited and BTCDana is not endorsing or recommending any investment or trading discussed in the material. Before acting on this material, you should consider whether it is suitable for your circumstances and as necessary, seek professional advice.


