Market Analysis of Gold on Thursday 9 September 2021
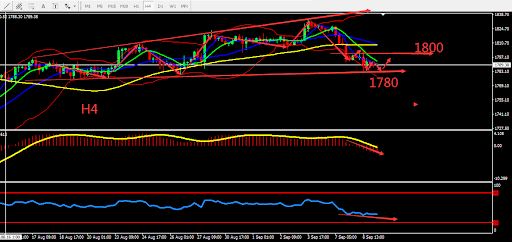
On Wednesday, Gold continued to fall in the short term to $1780 which was the lowest level in two weeks. The strengthening of US dollar overcomes concerns about global economic growth which is a boost to gold prices. As markets feared that the Delta variant would slow the pace of economic recovery and US stocks' poor performance in September, the three major US stock indexes continued to fall, with the Nasdaq falling more than 1%. The Bank of Canada kept interest rates unchanged and issued no signal to reduce the size of its bond purchases.
Technically, after the gold daily chart closed with a large bearish candle, the gold candle closed with a doji pattern. The gold price broke the support from the middle BOLL band, and the bearish position continued. On the 4-hour chart the gold candle is operating around the lower BOLL band and is slowly decreasing. MACD volume is strengthening downwards, and there is no signal to stop falling yet. Overall prioritize selling at high prices in the fluctuation zone. Consider the support zone and resistance zone, the deciding point whether to buy or sell is near 1780

Resistance:1793-1800-1808
Support:1780-1774-1770
Market Analysis of Crude Oil on Thursday 9 September 2021
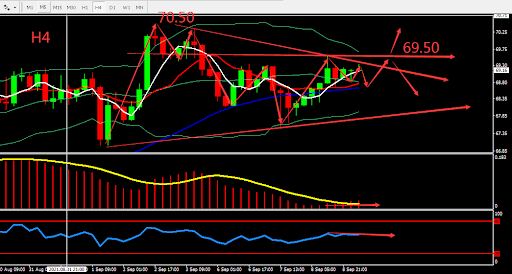
On Thursday Asian session, crude oil fluctuated around 69.20. API data showed that crude oil inventories fell by 2.882 million barrels, gasoline inventories fell by 6.414 million barrels, and refined oil fell by 3.748 million barrels, which was lower than expected. US data shows that there are still 73 oil and natural gas production platforms in an inactive state. The slow progress of oil producers in the Gulf of Mexico in resuming production after Hurricane Ida has passed has provided support for the upward trend of oil prices.
From a technical perspective, the daily graph closed bullish after 3 bearish candles. Crude oil moved above the middle bollinger band. In the short term, 70.50 is still the key point. On H4 graph, BOLL narrowed, MA5 and MA10 formed Golden Cross and moved upward. The trend was stable. Overall, prioritise operation within the fluctuation zone, the opportunity lies in EIA data. The chart below is showing the key point and the estimated trend, the deciding point whether to buy or sell is near 69.50.

Resistance:69.50-70.50-71.50
Support:68.50-67.80-67.00
This material is from Quant Tech Limited and is being posted with permission from Quant Tech Limited. The views expressed in this material are solely those of the author and/or Quant Tech Limited and BTCDana is not endorsing or recommending any investment or trading discussed in the material. Before acting on this material, you should consider whether it is suitable for your circumstances and as necessary, seek professional advice.


