Market Analysis of Gold on Wednesday 8 September 2021
On Tuesday, with the end of the long US Labor Day holiday, the spot gold price plunged US$30, approaching the US$1,790 mark. Silver, palladium, and platinum also fell one after another, and the market was a bloodbath. The US dollar index strengthened as US Treasury yields increase. A stronger US dollar index and US Treasury yields increase the cost of holding gold. The spread of the delta variant made market concerned over economic growth strengthened which resulted in the three major US stock indexes falling.
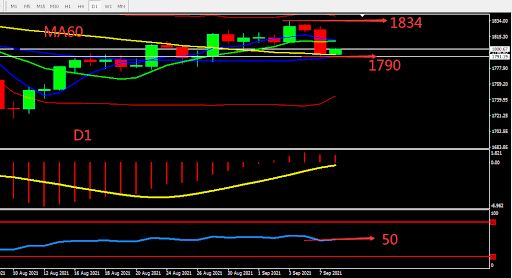
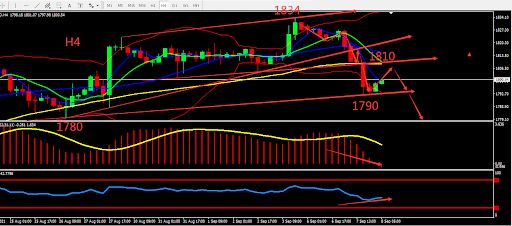
From a technical perspective, Gold peaked in 1834 in the short term. Currently gold has support from MA60 and the middle Bollinger band, and stopped weakening near 1790. The 4 hours chart shows that gold broke through the upwards trendline. The market's bearish sentiment is quite heavy, and the MA formed death cross, MACD is showing market change and indicators are currently bearish. Overall prioritize Selling at high prices in the fluctuation zone. Consider the support zone and resistance zone, the deciding point whether to buy or sell is near 1790.


Resistance:1804-1810-1818
Support:1790-1784-1770
Market Analysis of Crude Oil on Wednesday 8 September 2021
On Wednesday Asia session, the oil fluctuated around 68.25. Oil prices fell on Tuesday affected by concerns about the strengthening of the U.S. dollar and the slowdown in economic recovery due to the rapid spread of the Delta variant virus in Asia, as well as the sharp drop in the price of Asian crude oil contracts by Saudi Arabia on Sunday. The market's demand slowed down, which also limited the strengthening of oil prices. However, the positive Chinese trade data and continued production interruptions in the U.S. Gulf Coast have limited the decline in price.
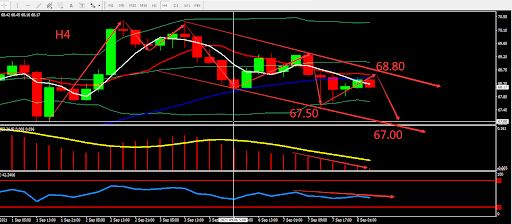
From a technical perspective, the daily graph closed with 3 consecutive bearish candles. The short-term moving average converges and moved upwards but faced resistance, and the indicators were neutral. On H4 graph, there was pressure from the previous M pattern and formed a downward channel. The indicators showed bearish signal. Overall, prioritise Sell at the high position within the fluctuation zone. The chart below is showing the key point and the estimated trend, the deciding point whether to buy or sell is near 68.80.

Resistance:68.80-69.30-70.40
Support:67.50-67.00-65.00
This material is from Quant Tech Limited and is being posted with permission from Quant Tech Limited. The views expressed in this material are solely those of the author and/or Quant Tech Limited and BTCDana is not endorsing or recommending any investment or trading discussed in the material. Before acting on this material, you should consider whether it is suitable for your circumstances and as necessary, seek professional advice.


