


Market Analysis of Gold on Tuesday 7 September 2021
On Monday, the US and Canadian trading markets were closed for Labour Day, so trading on the market was relatively quiet. As the US non-farm employment data released last week was much worse than expected, investors put off expectations that the Fed will start easing large-scale stimulus measures. However, the US dollar index is still strengthening. As the US dollar rebounded, gold fell, and currently gold is trading above $1820. This week several Fed officials, including New York Fed Chair Williams, will deliver speeches.
Technically, gold's daily candle shows a gradual increase. Gold rose then undergo correction and is gathering momentum to reach new highs. The 4-hour chart shows that gold found support from the middle Bollinger band and is in an upward channel and form a triangle pattern. All indicators show bullish signals. Overall prioritize buying at low prices in the fluctuation zone. Consider the support zone and resistance zone, the deciding point whether to buy or sell is near 1823.

Resistance:1829-1834-1844
Support:1823-1820-1812
Market Analysis of Crude Oil on Tuesday 7th September 2021
On Monday, crude oil fell by US$0.47, or 0.69%, and closed at US$68.61 per barrel. In a statement, Saudi Aramco informed customers that it will lower the October official selling price (OSP) of all crude oil grades by at least $1 per barrel, which has triggered market concerns about the demand outlook. At the same time, the return of the new corona virus continues to cloud demand prospects. The closure of some crude oil production in the Gulf of Mexico and the latest reports of crude oil leakage may curb the decline in oil prices in the short term.
From a technical perspective, the daily candle closed by Bearish Doji Star, and the indicators tend to be neutral. On H4 graph, the BOLL closed, crude oil price moved around the middle Bollinger band. MA5 and MA10 converged, forming a triangle pattern. Overall, prioritise operation within the fluctuation zone. The chart below is showing the key point and the estimated trend, the deciding point whether to buy or sell is near 68.10.
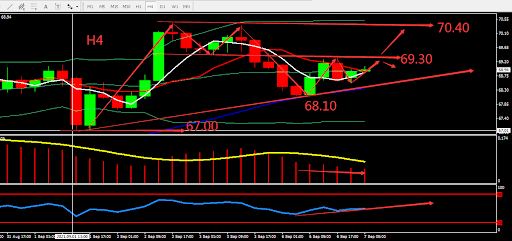
Resistance:69.30-70.40-71.60
Support:68.50-68.10-67.00
This material is from Quant Tech Limited and is being posted with permission from Quant Tech Limited. The views expressed in this material are solely those of the author and/or Quant Tech Limited and BTCDana is not endorsing or recommending any investment or trading discussed in the material. Before acting on this material, you should consider whether it is suitable for your circumstances and as necessary, seek professional advice.