Market Analysis of Gold on Friday 3 September 2021
On Thursday, Gold declined slightly. Prior to the release of US non-farm employment data in August, gold fluctuated at narrow intervals. NFP data is considered important for the Fed's plans to reduce bond purchases. The number of initial claims for unemployment benefits was 340,000 last week, while the market forecast was 345,000, dropping to its lowest level since March 2020. This is a sign that the labour market is recovering since the epidemic. The number of factory orders increased by 0.4% in July.
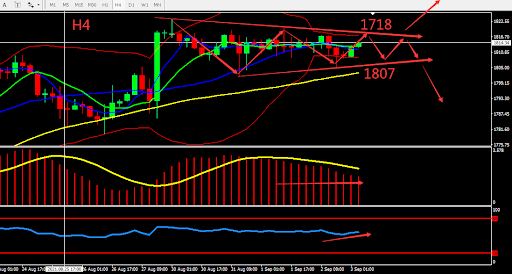
Technically, gold’s day candle continued to fluctuate in small intervals and closed with a bearish doji. MA converges and awaits a breakout, other indicators are relatively neutral. The 4-hour chart shows the formation of an upward channel. The support of the 60-day MA is quite clear, the MACD remains strong, the RSI indicator is relatively neutral. Overall, prioritize operations in the fluctuation zone while waiting for Nonfarm Payroll data to be released. Consider the support zone and resistance zone, the deciding point whether to buy or sell is near 1807

Resistance:1818-1824-1830
Support:1807-1800-1790
Market Analysis of Crude Oil on Friday 3rd September 2021
On Friday Asia session, crude oil fluctuated around 69.75, and oil prices rose by more than 2% on Thursday. The market has digested OPEC+’s additional supply, as the U.S. Gulf of Mexico has just been hit by Hurricane Ida; although Hurricane Ida has left, nearly 94% of the crude oil production capacity in the Gulf of Mexico is still closed. The weakening of U.S. dollar also supported oil prices and it was also affected by a rebound driven by optimism about global economic growth.
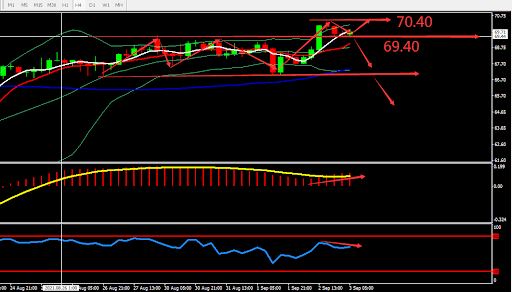
From a technical perspective, the daily candle closed bullish. The V pattern reversal is basically completed. H4 graph formed Doji Star on the high position and is continuously bearish. There's a chance of correction. The Bollinger track is parallel and crude oil fluctuates between the intervals. On H1 graph, MA5 and MA10 went downward and formed Death Cross. MACD formed Death Cross and the green volume strengthened. Overall, prioritise operation within the fluctuation zone. The chart below is showing the key point and the estimated trend, the deciding point whether to buy or sell is near 69.40.

Resistance:70.40-71.00-71.70
Support:69.40-68.80-67.70
This material is from Quant Tech Limited and is being posted with permission from Quant Tech Limited. The views expressed in this material are solely those of the author and/or Quant Tech Limited and BTCDana is not endorsing or recommending any investment or trading discussed in the material. Before acting on this material, you should consider whether it is suitable for your circumstances and as necessary, seek professional advice.


