


Market Analysis of Gold on Thursday 2 September 2021
On Wednesday, Gold found support above $1800 dan continued its increase on the early market of Thursday. The U.S. ADP employment population increased by only 374,000 in August, far below the expected increase of 613,000. The US August ISM manufacturing PMI data is 59.9, which is expected to be 58.6, and the previous value is 59.5. After the number of jobs fell far below expectations, the U.S. dollar fell. The data lowered the market's expectations for the US non-agricultural employment report and the Fed's tightening of easing policies.
From a technical perspective, gold's daily candle closed with a doji pattern, indicating the market's lack of direction. The market is waiting for guidance from Friday’s NFP data. H4 graph shows sideways consolidation. The BOLL is closing, which indicates that a change in market is about to happen. MA forms Golden Cross, MACD is also strong. Overall prioritise Buy within the fluctuation zone. The chart below is showing the key point and the estimated trend, the deciding point whether to buy or sell is near 1807.
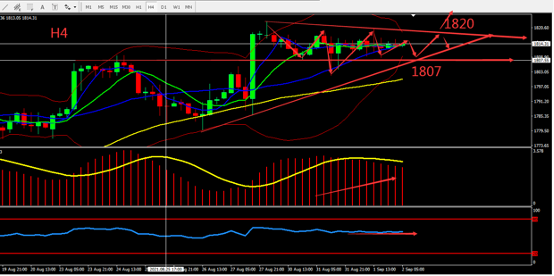
Resistance:1820-1824-1830
Support:1807-1800-1790
Market Analysis of Crude Oil on Thursday 2 September 2021
The fundamentals guided the market on Wednesday. After OPEC+'s short video conference, it was agreed to abide by the existing monthly schedule of gradual increase in production, which is in sharp contrast with the difficult negotiations in July, which is a phenomenon that is welcomed by the market. EIA data showed that crude oil inventories fell sharply by 7.169 million barrels during the week, a drop that exceeded expectations, providing a bullish signal for oil prices. Although the number of rigs and oil prices are rising, U.S. crude oil production is still under control.
From a technical perspective, the daily candle closed by Doji Star after three consecutive bearish candles. The market was relatively volatile yesterday. The overall indicators tended to be neutral. On H4 graph, crude oil maintained the channel structure. BOLL was flat, MA formed Death Cross at the high position and went downward. RSI was relatively neutral. Overall, prioritise operation within the fluctuation zone. The chart below is showing the key point and the estimated trend, the deciding point whether to buy or sell is near 67.00.
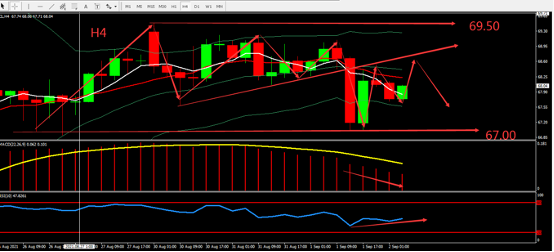
Resistance:68.70-69.50-70.00
Support:67.60-67.00-66.00
This material is from Quant Tech Limited and is being posted with permission from Quant Tech Limited. The views expressed in this material are solely those of the author and/or Quant Tech Limited and BTCDana is not endorsing or recommending any investment or trading discussed in the material. Before acting on this material, you should consider whether it is suitable for your circumstances and as necessary, seek professional advice.