Market Analysis of Gold on Monday 1 September 2021
On Tuesday American session, the U.S. dollar index rebounded at hits its daily high. Gold fell first and then rose and rebounded strongly after approaching the $1,800 mark. The three major US stock indexes continue to fluctuate. The housing price index of the 20 major cities in June, the Chicago Purchasing Managers' Index in August and the Consultative Chamber Consumer Confidence Index in August showed mixed performances which had a negative impact on the US dollar.
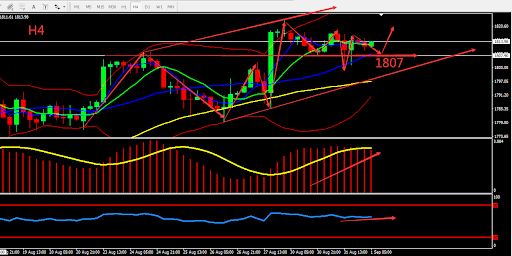
From a technical perspective, the daily line closed bullish with upper and lower shadow, the market loses its directions. The daily indicators overall are neutral. On the 4-hour chart, the Gold candle shows a ladder top, MACD is strengthening, the opening of the BOLL is pointing upwards and getting support from MA60. Overall prioritize Buy on low in the fluctuation zone. This Friday, the August US non-farm jobs report is an opportunity for a breakout. Consider the support zone and resistance zone, the deciding point whether to buy or sell is near 1807

Resistance:1819-1824-1830
Support:1807-1800-1790
Market Analysis of Crude Oil on Monday 1 September 2021
On Wednesday Asia session, crude oil went upward slightly. Current price of oil is at around $68.90. API data show that crude oil inventories decreased by 4.045 million barrels, gasoline inventories increased by 2.711 million barrels, refined oil inventories decreased by 1.961 million barrels, and Cushing crude oil inventories increased by 2.128 million barrels. Declining inventories and Hurricane Ida led to the closure of refineries near the Gulf of Mexico in the United States, which provided support to oil prices. The OPEC+ conference was held today, and the market expected an increase in production, which is not good for oil prices.
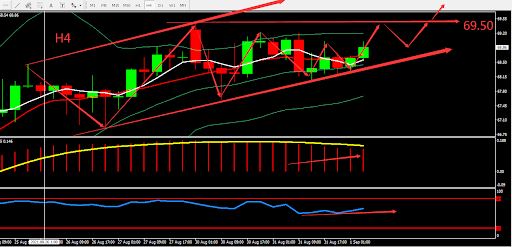
From a technical perspective, the daily candle closed bearish and continued to moving above the middle BOLL band. MACD moved below the 0 axis and formed Golden Cross, overall, there is consolidation. On H4 graph, MA converges and move upwards, RSI also move upward. Overall, prioritise Buy within the fluctuation zone. The chart below is showing the key point and the estimated trend, the deciding point whether to buy or sell is near 69.50.

Resistance:69.50-70.00-71.50
Support:68.00-67.50-66.80
This material is from Quant Tech Limited and is being posted with permission from Quant Tech Limited. The views expressed in this material are solely those of the author and/or Quant Tech Limited and BTCDana is not endorsing or recommending any investment or trading discussed in the material. Before acting on this material, you should consider whether it is suitable for your circumstances and as necessary, seek professional advice.


