Market Analysis of Gold on Monday 31 August 2021
On Tuesday’s Asian session, Gold was stable at around 1813. On Monday, gold skyrocketed then dropped and closed with a drop of 0.4%. After Fed Chair Powell's earlier remarks that were interpreted as dovish, the dollar was steady after falling to a two-week low. The market is also very cautious before the release of the US employment report (Non-farm Payroll). The S&P500 and Nasdaq Index hit record highs, which boosted risk-taking sentiment at the start of the week. This is not a good thing for safe-haven gold.
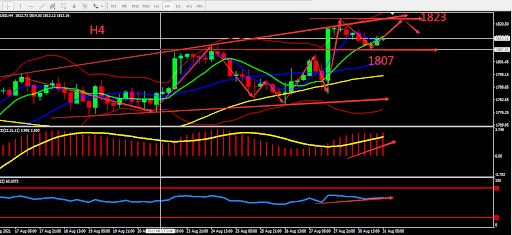
From a technical perspective, gold strengthened and weakened, closing with a small bearish candle. The daily candle finds support from the moving averages that form the Golden Cross, providing relatively strong support for the bulls. In the 4 hours chart, it can be shown that an upward fluctuation has completed and gold is under correction at around 1807. Overall, prioritize buying at low prices in the fluctuation zone. Consider the support zone and resistance zone, the deciding point whether to buy or sell is near 1807.

Resistance:1818-1823-1830
Support:1807-1800-1790
Market Analysis of Crude Oil on Monday 31 August 2021
On Tuesday Asian market, crude oil fluctuated around 68.80. Oil prices closed moderately higher on Monday. Hurricane Ida landed in Louisiana. According to data from the U.S. Security and Environmental Enforcement Agency, the U.S. Gulf of Mexico shut down 94.6% of crude oil production, and a total of 288 oil and gas production platforms were evacuated. Note that the Organization of Petroleum Exporting Countries (OPEC) and its allies will increase oil production as planned.
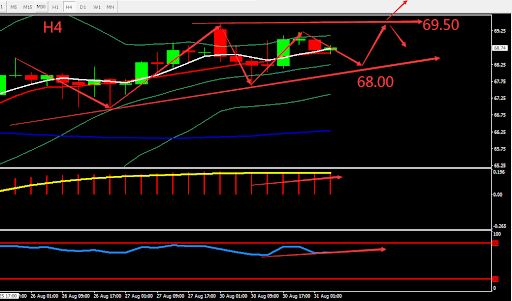
From a technical perspective, the daily candle closed bearish with a long lower shadow. MACD moved under 0 axis and formed Golden Cross. MA60 suppressed the short-term moving average, MA5 and MA10, and formed Golden Cross. On H4, the price is under pressure from 69.50, the strengthening trend line found support line around 68.00. The indicators show bullish sign. Overall, prioritise Buy on the low position. The chart below is showing the key point and the estimated trend, the deciding point whether to buy or sell is near 69.50.

Resistance:69.50-70.00-71.50
Support:68.00-67.50-66.80
This material is from Quant Tech Limited and is being posted with permission from Quant Tech Limited. The views expressed in this material are solely those of the author and/or Quant Tech Limited and BTCDana is not endorsing or recommending any investment or trading discussed in the material. Before acting on this material, you should consider whether it is suitable for your circumstances and as necessary, seek professional advice.


