Market Analysis of Gold on Monday 30 August 2021
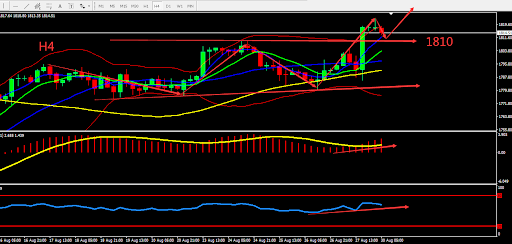
On Monday's Asian session, gold skyrocketed then fell again, hitting a high of US$1823, and is currently fluctuating around US$1814. Gold prices rose 1.4% last Friday due to the Fed Chair Powell's dovish speech at the Jackson Hole meeting, suggesting that this year is the perfect time to start cutting back on bond sales. However, a reduction in bonds does not directly signal that interest rates will increase. At the same time, he also said that inflation is a temporary problem. This makes the risk aversion sentiment by buying gold warm. In addition, several data in the United States were weak, which also supported the rise in gold prices.
Technically, the daily, weekly, and 4-hour chart gold candles are simultaneously moving upwards, forming a large bullish candle. The indicator has also exited the fluctuatuin zone and started an upward trend. Overall, prioritize operation in the fluctuation zone. Consider the support zone and resistance zone, the deciding point whether to buy or sell is near 1810

Resistance:1820-1824-1830
Support:1810-1800-1790
Market Analysis of Crude Oil on Monday 30 August 2021
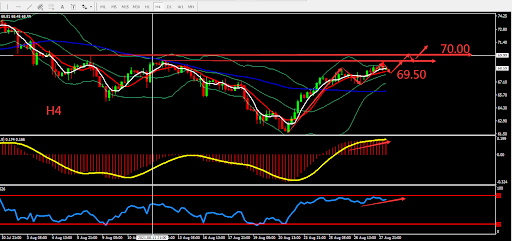
Last week, oil prices reached its biggest weekly increase since June last year. Reports said there will be a major hurricane this week. Producers had shut down 59% of the Gulf of Mexico capacity last Friday. Regulators said that 95% of crude oil production (with capacity equivalent to approximately 1.7 million barrels per day) and 85% of natural gas production capacity are closed. Refining and chemical plants along the Mississippi River, about 1.9 million barrels per day (equivalent to 10% of the US total) have been closed or reduced operating rates, to provide support for the upward oil price.
From a technical perspective, the weekly candle closed bullish and formed Engulfing pattern. The daily candle moved above BOLL middle line. MA5 and MA10 formed Golden Cross. H4 graph shows an upwards trend, BOLL closed with an opportunity to go upward. Overall, prioritise Buy within the fluctuation zone. The chart below is showing the key point and the estimated trend, the deciding point whether to buy or sell is near 69.50.

Resistance:69.50-70.00-71.50
Support:67.90-67.00-65.50
This material is from Quant Tech Limited and is being posted with permission from Quant Tech Limited. The views expressed in this material are solely those of the author and/or Quant Tech Limited and BTCDana is not endorsing or recommending any investment or trading discussed in the material. Before acting on this material, you should consider whether it is suitable for your circumstances and as necessary, seek professional advice.


