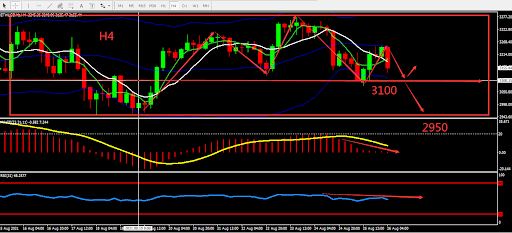
Ethereum fell rapidly in the Asian session on Thursday, breaking through the US$3,200 mark, and is now at US$3,150, with an intraday drop of 1.8%. The total hashrate of the Ethereum network is 602.91TH/s, the number of coin holding addresses has increased by 112,343, and the transaction volume on the 24h chain is 2,141,713.7ETH. The 2.0 deposit contract address has received 7,148,400 ETH, accounting for 6.11% of the current supply, and the total value of destroy ETH has broken through 300 million USD.
From a technical point of view, Ethereum’s daily candle close with a doji pattern. The moving averages converges and is under pressure. The MACD volume is still strong and the daily graph shows an upward channel. In H4 graph, EURUSD is operating under the middle BOLL band and the MACD is below the 0 axis, there is an obvious signs of weakening. Overall prioritize selling at high prices on the fluctuation zone. Consider the support zone and resistance zone, the deciding point whether to buy or sell is near 3100.

Resistance:3200-3250-3380
Support:3100-3000-2950
This material is from Quant Tech Limited and is being posted with permission from Quant Tech Limited. The views expressed in this material are solely those of the author and/or Quant Tech Limited and BTCDana is not endorsing or recommending any investment or trading discussed in the material. Before acting on this material, you should consider whether it is suitable for your circumstances and as necessary, seek professional advice


