Market Analysis of Gold on Thursday 26 August 2021
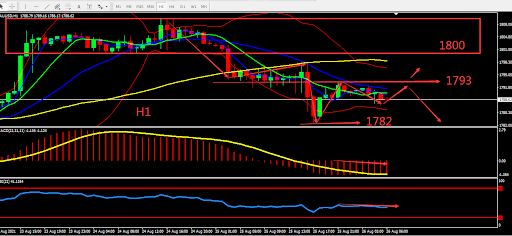
On Thursday Asian session, Gold was steady around 1790. Gold prices declined slightly on Wednesday, and market risk sentiment continued to improve after the FDA approved full use of the Pfizer/BioNTech vaccine to prevent the Delta variant virus. This put pressure on gold prices, but the pandemic and waning concerns about the Fed's early QE cuts are supporting gold prices. For today, focus on the initial value of the number of claims for unemployment benefits, the United States' second quarter real GDP and the annual meeting of global central banks Jackson Hole.
From a technical perspective, gold's daily candle closed bearish forming the evening star pattern. MA is convergent and looks like it will soon choose the direction of the market. The 4-hour chart shows that the Gold candle fell below the middle BOLL band. The fluctuation zone falls back below 1800. Overall, prioritize selling at high prices in the fluctuation zone. Consider the support zone and resistance zone, the deciding point whether to buy or sell is near 1800

Resistance:1793-1800-1810
Support:1782-1776-1770
Market Analysis of Crude Oil on Thursday 26 August 2021
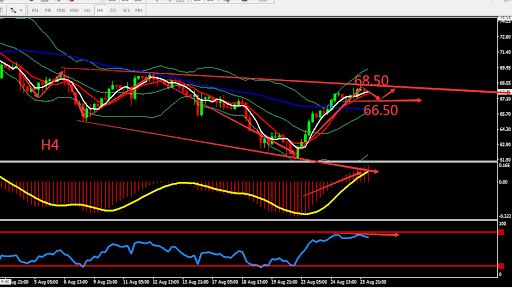
On Thursday Asia session, crude oil fluctuated around 67.80, and oil prices rose by more than 1% on Wednesday, rising for the third consecutive trading day. According to EIA data, as of the week of August 20, crude oil inventories fell by 2.98 million barrels to 432.6 million barrels, gasoline inventories fell by 2.241 million barrels, and U.S. refined oil demand reached its highest level since March 2020, indicating that oil prices continued to rise, provide momentum for oil prices to continue going upward.
From a technical perspective, crude oil’s daily candle closed bullish, but it is still under pressure by MA22. MA formed Golden Cross in the short-term, the overall trend showed rebound trend after a sharp drop. H4 graph shows that crude oil is stable around the MA60 and shows signs of strengtheninh. Cride oil fluctuated above the middle BOLL band, RSI fluctuated around level 50, and the upward momentum of crude oil weakened. Overall, prioritise operation within the fluctuation zone. The chart below is showing the key point and the estimated trend, the deciding point whether to buy or sell is near 68.50.

Resistance:68.50-69.40-70.00
Support:67.20-66.50-65.50
This material is from Quant Tech Limited and is being posted with permission from Quant Tech Limited. The views expressed in this material are solely those of the author and/or Quant Tech Limited and BTCDana is not endorsing or recommending any investment or trading discussed in the material. Before acting on this material, you should consider whether it is suitable for your circumstances and as necessary, seek professional advice.


