Market Analysis of Gold on Wednesday 25 August 2021
In Wednesday's Asian session, the US dollar index suddenly rose in the short term and returned above 93. Gold is down almost US$10 in the short-term and is down below US$1795 per ounce. On Tuesday, G7 leaders sought a unified decision on the Taliban's control leadership and whether they would impose sanctions on the organization. On Tuesday, the U.S. House of Representatives passed the $3.5 trillion budget blueprint by a vote of 220-212, paving the way for the Senate to implement budget coordination procedures to finalize the bill.
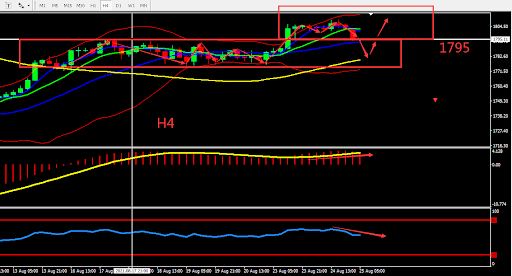
From a technical perspective, gold's daily candle closed with Doji pattern at a high level and was under resistance from 60-day moving average, there are signs of a change in market. H4 graph shows a fight at around 1795, the indicators show bullish and bearish signs, wait till there is a breakout. Overall prioritize operation in the fluctuation zone. Consider the support zone and resistance zone, the deciding point whether to buy or sell is near 1795.

Resistance:1800-1810-1818
Support:1786-1779-1770
Market Analysis of Crude Oil on Wednesday 25 August 2021
On Tuesday, Crude oil rose 2.13 USD, an increase of 3.25%, and the settlement price was reported at 67.55 US dollars per barrel. The successful control of the epidemic by major oil-consuming countries has boosted optimistic expectations for a recovery in demand. Mexico’s oil production was reduced by 421,000 barrels per day due to a fire on an oil platform, providing support for rising oil prices. US API data showed that crude oil inventories decreased by 1.622 million barrels, gasoline inventories decreased by 985,000 barrels, and refined oil inventories decreased by 245,000 barrels.
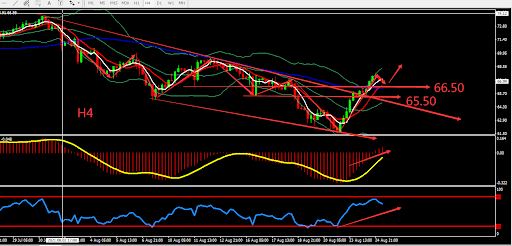
From a technical perspective, the daily candle closed bullish again, the RSI turned head, the daily candle fluctuates upwards between MA5 and upper BOLL band. The graphic forms V pattern and shows signs of reversal. Overall, prioritise Buy within the fluctuation zone. The chart below is showing the key point and the estimated trend, the deciding point whether to buy or sell is near 66.50.

Resistance:67.70-68.50-69.40
Support:66.50-65.50-64.00
This material is from Quant Tech Limited and is being posted with permission from Quant Tech Limited. The views expressed in this material are solely those of the author and/or Quant Tech Limited and BTCDana is not endorsing or recommending any investment or trading discussed in the material. Before acting on this material, you should consider whether it is suitable for your circumstances and as necessary, seek professional advice.


