Market Analysis of Gold on Monday 23 August 2021
On Monday the Asian session, the US dollar index fell short-term and is currently approaching 93.30. Gold has strengthened and is currently hovering around $1,788 an ounce. The delta variant continues to spread globally, and markets are concerned that the lockdown measures for the sake of the epidemic will hamper economic growth. Gold found support on demand for hedging assets. But benchmark 10-year US Treasury bond yields rose, increasing the cost of holding gold. This week, focus on the Jackson Hole Central Bank Annual Meeting, Powell's speech, US GDP, PCE, etc.
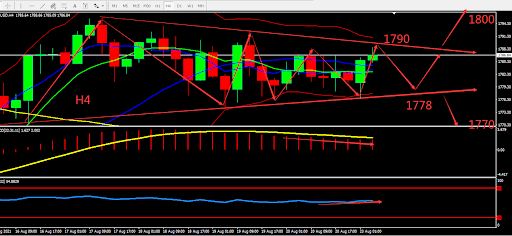
Technically, gold's daily line continues to fluctuate for a long time and indicators are becoming passive. On the 4 hours chart, gold continues to operate around the BOLL. MACD will fall back to zero axis and the indicator is relatively neutral. Overall, prioritize fluctuations within the fluctuation zone. Consider the support zone and resistance zone, the deciding point whether to buy or sell is near 1800.

Resistance:1790-1800-1815
Support:1778-1770-1763
Market Analysis of Crude Oil on Monday 23 August 2021
On Monday Asian session, crude oil fluctuates around $63.20. The price of oil dropped since last Friday and records the longest consecutive decline since 2019. This is because the Fed signalled a decrease in obligation purchase which caused the strengthening of dollar. The resurgence of the new virus also made the outlook of crude oil demand questionable. In response to the increased infection rate caused by the mutant virus, many countries have increased travel restrictions to cut off the spread. Chinese ports have implemented a new "zero tolerance" policy for the epidemic, which has affected shipping and global supply chains.
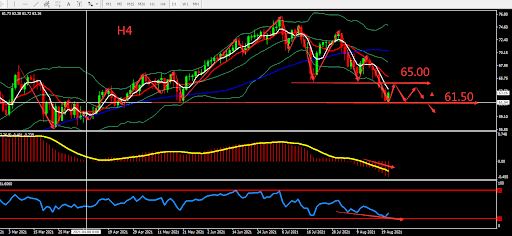
From a technical point of view, the weekly candle of crude oil closed very bearish and test the support formed on 2nd May and broke through BOLL. The daily candle also formed 7 consecutive bearish candles. Indicators show bearish signs, and the bearish sentiment took over the market. H4 graph showed that MACD volume increased downloads, but beware that RSI shows signs of reversal. Overall prioritise Sell on High on fluctuation zone. The chart below is showing the key point and the estimated trend, the deciding point whether to buy or sell is near 61.50.

Resistance:64.00-65.00-66.00
Support:62.40-61.50-60.00
This material is from Quant Tech Limited and is being posted with permission from Quant Tech Limited. The views expressed in this material are solely those of the author and/or Quant Tech Limited and BTCDana is not endorsing or recommending any investment or trading discussed in the material. Before acting on this material, you should consider whether it is suitable for your circumstances and as necessary, seek professional advice.


