On Thursday, funds flowed into the US dollar, and the strong rise of the US dollar dragged down the price of gold, making the price of gold fell to $1774 during the session. The number of initial unemployment claims in the United States was 348,000, better than the 364,000 forecast and down 29,000 from the previous value. This is the fourth week in a row that the number of initial unemployment claims in the United States has fallen, and the labor market is recovering. The minutes of the Federal Reserve meeting signalled that it may be appropriate to reduce debt buying this year, coupled with the impact of the new delta variant on the outlook for the economic recovery, gold is at risk and under pressure.
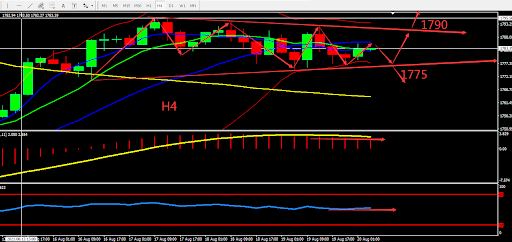
From a technical perspective, gold's daily candle continues to close slightly bullish with a doji pattern. The market lost its direction. The 4-hour chart shows the BOLL is narrowing, the MA is converging dan indicator are neutral. There might be a change in market soon. Overall prioritise operation within the fluctuation zone. Consider the support zone and resistance zone, the deciding point whether to buy or sell is near 1790.

Resistance :1790-1800-1815
Support:1775-1763-1753
Market Analysis of Crude Oil on Friday 20 August 2021
On Thursday, crude oil continued to fall under pressure by US$0.56 and reach the lowest point on US$62.38 per barrel. The International Energy Agency stated that the slowdown in demand for crude oil due to some restrictive measures taken to limit the rapid spread of the Delta virus conflicts with the recent growth in global crude oil production. The outlook for the global oil market has become bleak. Saudi Arabia's crude oil exports in June increased for the second consecutive month, reaching 5.965 million barrels per day.
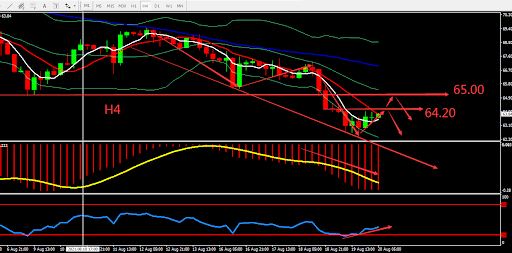
From a technical perspective, the daily crude oil line has formed bottom ladder for 6 consecutive days, MA is divergent and forms Death Cross and MACD volume has dropped. On H4 graph, MA5 strengthened, RSI shows signs of rebound. The Bollinger Band has opened downward. In a short-term, the probability of crude oil to continue declining has decreased. Overall, prioritise operation within fluctuation zone. The chart below is showing the key point and the estimated trend, the deciding point whether to buy or sell is near 65.00.

Resistance:64.20-65.00-66.00
Support:63.00-62.30-61.50
This material is from Quant Tech Limited and is being posted with permission from Quant Tech Limited. The views expressed in this material are solely those of the author and/or Quant Tech Limited and BTCDana is not endorsing or recommending any investment or trading discussed in the material. Before acting on this material, you should consider whether it is suitable for your circumstances and as necessary, seek professional advice.


