Market Analysis of Gold on Thursday 19 August 2021
On Thursday's Asian session, gold weakened slightly and traded around 1781. US Federal Open Market Committee (FOMC) officials voted to keep short-term interest rates near zero. At the same time, they are optimistic about the rate of economic growth, suggesting that most officials expect to start scaling back bond purchases this year. In addition, overnight buy back operations hit record highs during the epidemic. The collective decline of US stocks became support for gold prices.
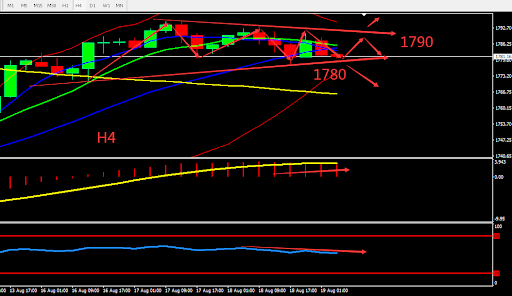
Technically, gold's daily candle closed the doji at high levels. The market lacks strength to test resistance above 1790-1800. MA is converging, and the indicators are relatively neutral. The 4-hour chart shows a triangle pattern indicating a bearish signal, the BOLL lines are narrowing and convering. Overall, prioritize selling at high prices within the fluctuation zone. Consider the support zone and resistance zone, the deciding point whether to buy or sell is near 1790

Resistance:1790-1800-1815
Support:1780-1773-1763
Market Analysis of Crude Oil on Thursday 19 August 2021
On Thursday Asia session, crude oil fluctuated around 64.10. EIA’s weekly report showed that crude oil inventories fell by 3.233 million barrels to 435.5 million barrels, the lowest since the week of January 31, 2020. Last week, US domestic crude oil production increased by 100,000 barrels to 11.4 million barrels per day, the highest level since May 2020. The market is concerned about the prospects of fuel demand, as the number coronavirus cases has surged globally.
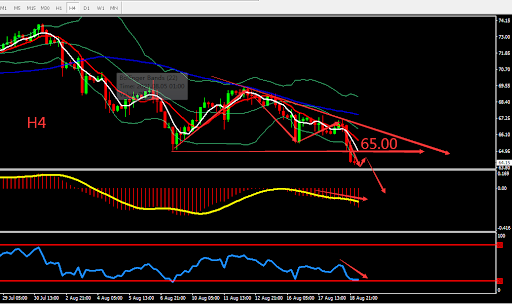
From a technical perspective, crude oil fell for the fifth consecutive day, falling below 65 and shows strong bearish trend. The daily indicator also shows bearish signs. On H4 graph, RSI shows a weak fluctuation at around 20. MA are diverging downwards. MACD volume also reduces. Overall, prioritise Sell on High on fluctuation zone. The chart below is showing the key point and the estimated trend, the deciding point whether to buy or sell is near 65.00.

Resistance:65.00-65.60-66.70
Support:63.50-62.30-61.50
This material is from Quant Tech Limited and is being posted with permission from Quant Tech Limited. The views expressed in this material are solely those of the author and/or Quant Tech Limited and BTCDana is not endorsing or recommending any investment or trading discussed in the material. Before acting on this material, you should consider whether it is suitable for your circumstances and as necessary, seek professional advice.


