Market Analysis of Gold on Wednesday, 18th August 2021
On Tuesday, gold fell to $1,780/ounce, down more than $15 from the day's high. US retail sales data in July showed a decline of 1.1%, lower than both forecast and the previous figure. The NAHB US real estate market index hit 75 in August, which was a 13-month low. The three major US stock indexes were down, the Dow and S&P 500 were down nearly 1%, while the Nasdaq was down more than 1.2%. Market focus shifts to Fed Chair Powell's speech and the Fed's July meeting minutes.
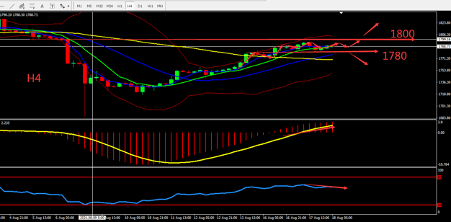
From a technical point of view, gold's daily candle closed with a doji pattern at high position, and resistance is around 1790-1800. The 4 hours chart shows gold still maintaining its fluctuation on high position. The BOLL’s upwards channel is perfectly formed, MA is converging, and the indicators are relatively bullish. Overall, prioritize buying at low prices in the fluctuation zone. Consider the support zone and resistance zone, the deciding point whether to buy or sell is near 1780

Resistance:1795-1800-1815
Support:1780-1773-1763
Market Analysis of Crude Oil on Wednesday, 18th August 2021
On Wednesday Asia session, crude oil fluctuated around 66.30. API data released in the morning showed that crude oil inventories were reduced, but the impact was limited. Since the OPEC+ member states reached an important agreement last month, oil prices have continued to fall, and has dropped more than 9% since the highest price reached in July. Due to the rapid increase in the number of confirmed cases of the new variant of covid virus in a short period of time, demand in Asia is weak. According to Goldman Sachs, China's crude oil demand is expected to decrease by 1 million barrels per day in August, and the crude oil market is under pressure.
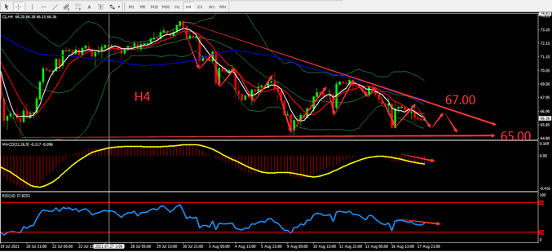
From a technical perspective, the daily candle has dropped and tested the key support level around level 65 for three times. Once it breaks through, the market will drop quickly. H4 graph shows the downward trend, MA forms Death Cross, MACD volume dropped quickly, the market shows bearish sign. Overall, prioritise operation within the fluctuation zone. If there is a breakthrough, open Sell position. The chart below is showing the key point and the estimated trend, the deciding point whether to buy or sell is near 65.00.

Resistance:67.00-68.00-68.80
Support:65.60-65.00-63.50
This material is from Quant Tech Limited and is being posted with permission from Quant Tech Limited. The views expressed in this material are solely those of the author and/or Quant Tech Limited and BTCDana is not endorsing or recommending any investment or trading discussed in the material. Before acting on this material, you should consider whether it is suitable for your circumstances and as necessary, seek professional advice.


