Market Analysis of Gold on Tuesday 17 August 2021
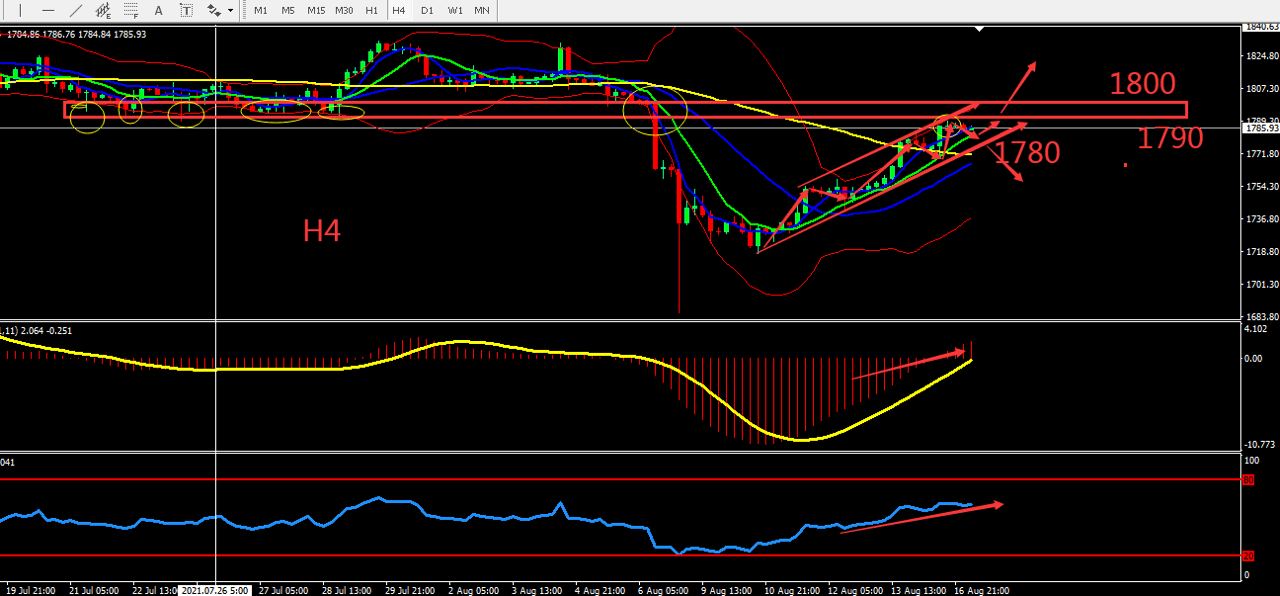
On Monday, the Gold market was slightly more active and rebounded from lows to near 1790. The three major US stock indexes opened poorly, among which the Nasdaq was the biggest loser, with a 1.2% decline. Economic data released by China and the United States were not as good as expected, causing the market to worry about the slowdown in global economic growth. At the same time, after the Taliban quickly took over Afghanistan, the situation in Afghanistan also affected the market and affected the ups and downs of gold.
Technically, the daily gold candle has entered a key resistance point at 1790-1800, forming the early stages of the M pattern. The 4 hours chart shows the candle is around the upper BOLL band, MACD reversed above the 0 axis, indicating a bullish signal. Overall, prioritize buying at low prices within the fluctuation zone. Consider the support zone and resistance zone, the deciding point whether to buy or sell is near 1790

Resistance:1790-1800-1815
Support:1780-1773-1763
Market Analysis of Crude Oil on Tuesday 17 August 2021
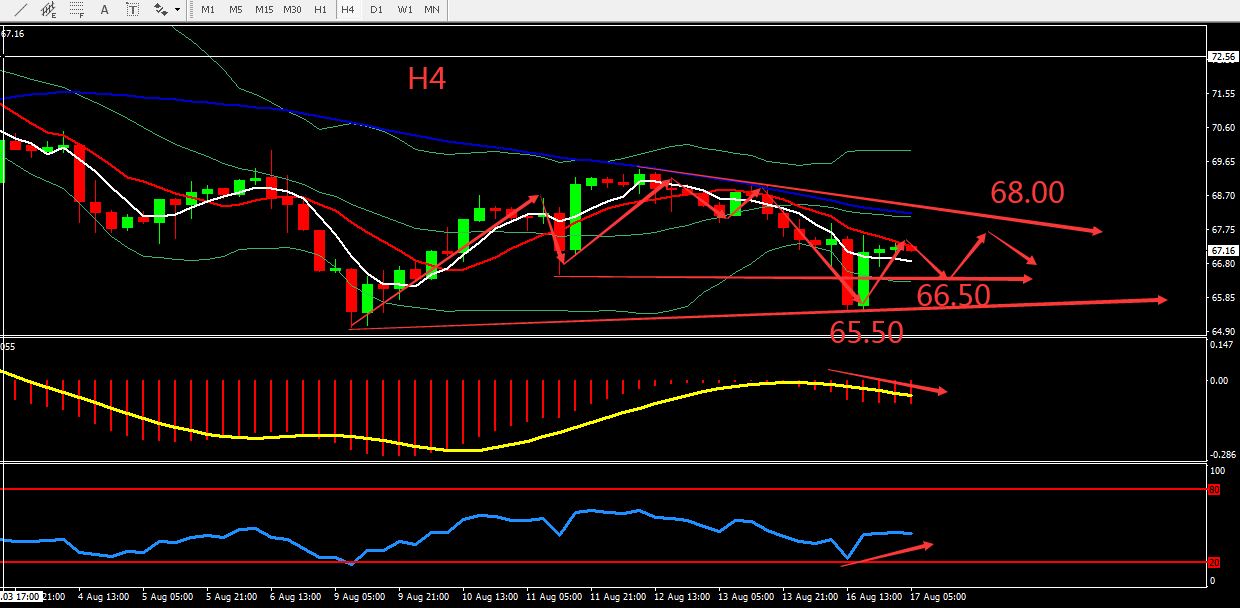
On Monday crude oil was under pressure due to the new wave of epidemics and flooding in the United States which disrupts business activities. The growth of manufacturing output and retail sales in the United States slowed down sharply in July, which fell short of expectations. In addition, reduction in crude oil processing due to the tightening of quotas, increased inventories and lower profits, and independent refiners have cut production. Yesterday, OPEC and its allies believed that the market would not need to release more oil than planned in the next few months, and crude oil would rebound by more than that.
From technical perspective, the daily candle closed by bearish candle with a long lower shadow. The candle was supported by the lower BOLL band, the overall trend was weak. On H4 graph, the price fluctuates below the middle BOLL band. H1 graph showed that BOLL is flat, and the market bearish sentiment has weakened. Overall, prioritise operation within the fluctuation zone and don't go overboard with Sell positions. The chart below is showing the key point and the estimated trend, the deciding point whether to buy or sell is near 68.00.

Resistance:68.00-69.00-70.00
Support:66.50-65.50-65.00
This material is from Quant Tech Limited and is being posted with permission from Quant Tech Limited. The views expressed in this material are solely those of the author and/or Quant Tech Limited and BTCDana is not endorsing or recommending any investment or trading discussed in the material. Before acting on this material, you should consider whether it is suitable for your circumstances and as necessary, seek professional advice.


