Market Analysis of Gold on Monday 16 August 2021
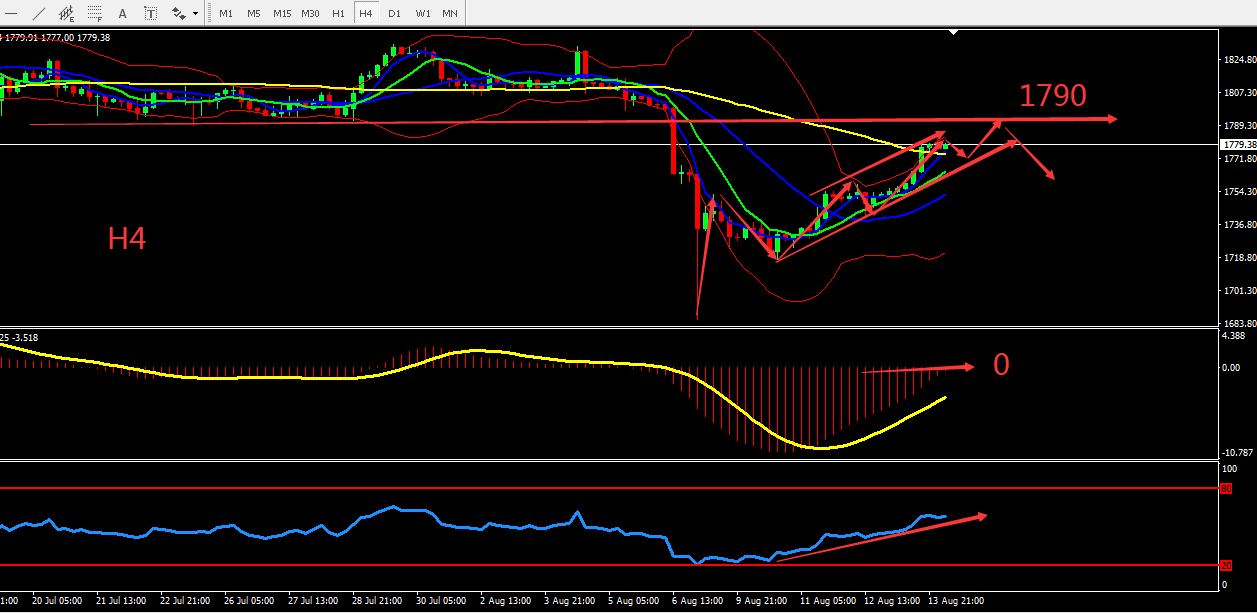
On Monday's Asian session, Gold fluctuates around 1780 in early trading. The US consumer confidence index was bad last week. Market expectations for an early Fed rate hike have cooled, US Treasury yields, and the US dollar have come under significant pressure, coupled with the surging number of positive cases of coronavirus causing gold prices to strengthen. However, markets will also be paying attention to this week's "terror data" and the minutes of the Federal Reserve's meeting. In addition, the political situation in Afghanistan has also received market attention.
From a technical perspective, the gold weekly candle touched the lower Bollinger band then rebounded strongly to reach the middle band of the Bollinger bands on the monthly chart, while the daily line is still under pressure. MACD and MA are still weak, the 4 hours chart shows that the RSI indicator is relatively strong and MACD is near the 0 axis. Overall, prioritize selling at high prices with the expectation that gold will strengthen before weakening. Consider the support zone and resistance zone, the deciding point whether to buy or sell is near 1755

Resistance:1790-1800-1815
Support:1773-1765-1758
Market Analysis of Crude Oil on Monday 16 August 2021
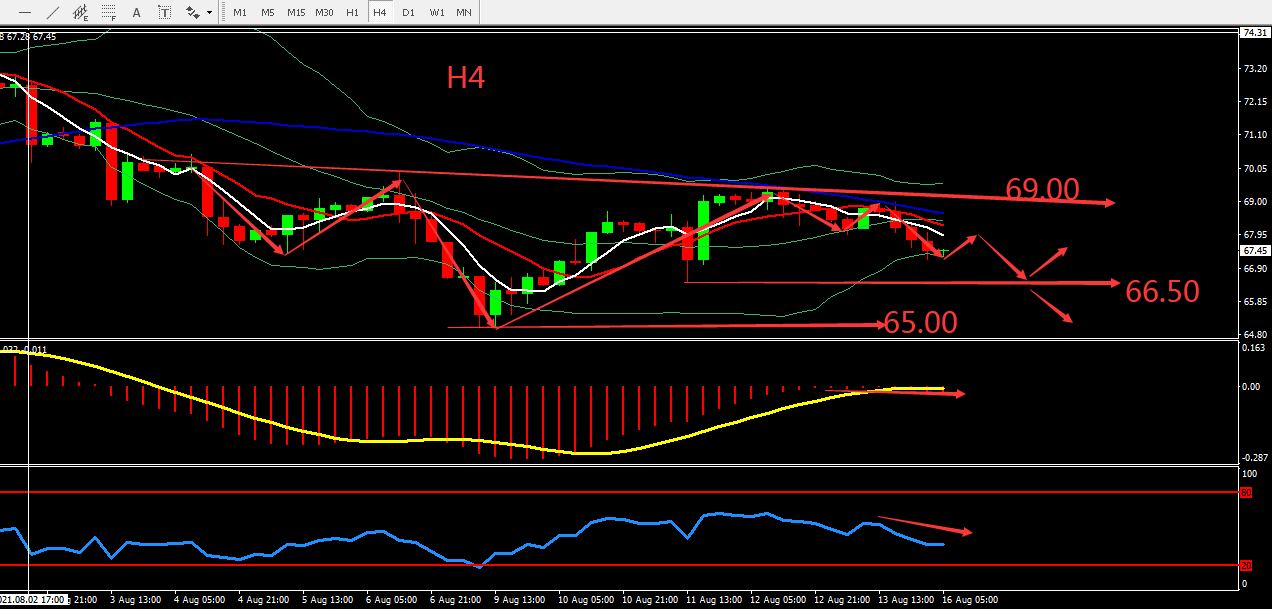
On Monday Asia session, crude oil fluctuated around 67.50. Last week, the U.S. Senate passed a $3.5 trillion spending plan with a slight advantage. The U.S. stock market has repeatedly set historical records. The decline in crude oil inventories has provided support for oil prices. However, the rebound in the number of cases of the new corona virus caused the IEA and other institutions to lower their crude oil demand growth expectations.
From a technical perspective, the weekly candles rose then fell and closed by doji pattern which will make the market lose their confidence and increase the probability of further weakening of market. The daily candle stabilized at the previous key point at 65.00. The market still show a ladder bottom trend and the indicators show bearish signal. H4 graph maintains a bearish fluctuation, and the indicator performance is neutral and bearish. Overall, prioritise Sell on the high position within the fluctuation zone. The chart below is showing the key point and the estimated trend, the deciding point whether to buy or sell is near 66.50.

Resistance:68.00-69.00-70.00
Support:66.50-65.80-65.00
This material is from Quant Tech Limited and is being posted with permission from Quant Tech Limited. The views expressed in this material are solely those of the author and/or Quant Tech Limited and BTCDana is not endorsing or recommending any investment or trading discussed in the material. Before acting on this material, you should consider whether it is suitable for your circumstances and as necessary, seek professional advice


