Market Analysis of Gold on Friday 13 August 2021
On Thursday gold prices rose slightly, as the market predicted that the US Fed would soon scale back its asset purchases, offsetting the impact of the strengthening US dollar and yields. Powell may find it increasingly difficult to maintain his dovish stance. The US Labor Department's July PPI gains were higher than expected. Combined with other data, it shows that the growth rate has slowed, but inflation remains high. At the same time, the number of initial unemployment claims has declined, but the recovery in the labor market is still uneven.
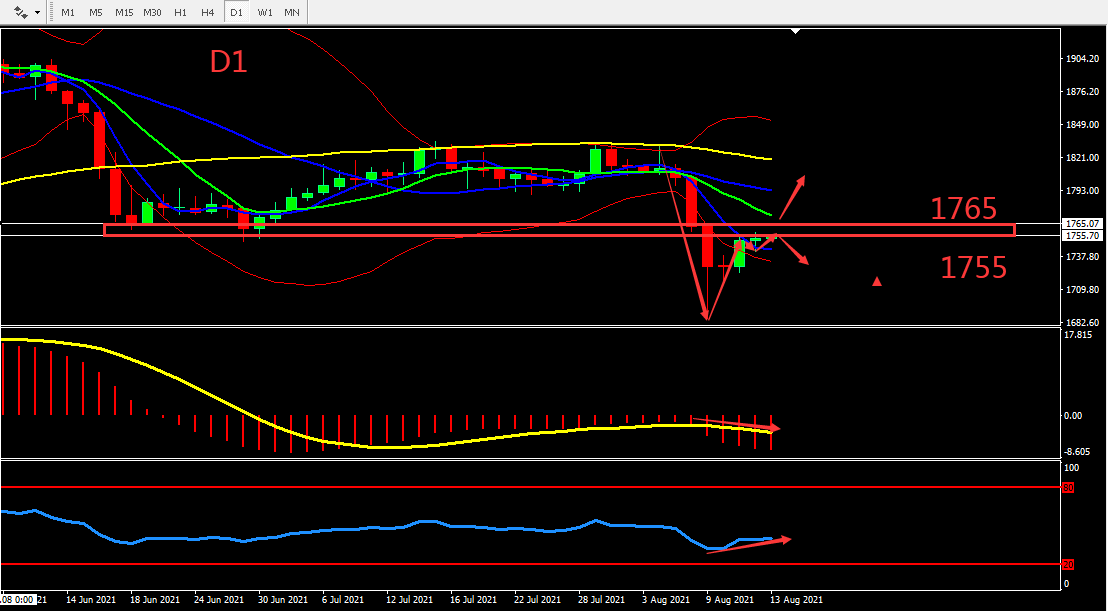
From a technical perspective, gold's daily line closed the doji and is still under pressure at the 1755-1765 line. The 4 hours chart shows signs of a rebound in the short term, but still continues to operate around the BOLL's upper line. MA formed a golden cross, but the trend in general is still bearish. Overall, prioritize selling at high prices, and prioritize buying if Gold has broken through 1765. Consider the support zone and resistance zone, the deciding point whether to buy or sell is near 1755

Resistance:1758-1765-1775
Support:1746-1738-1725
Market Analysis of Crude Oil on Friday 13 August 2021
On Friday Asia session, crude oil fluctuated around 68.35. On Thursday the price of oil fell. Earlier, the International Energy Agency (IEA) stated that the spread of the Delta variant of the new coronavirus will slow the recovery of global oil demand. OPEC released a monthly report saying that as its ally Russia's output is about to increase, they have lowered their forecast for the organization's crude oil demand by 1.1 million barrels per day in 2022.
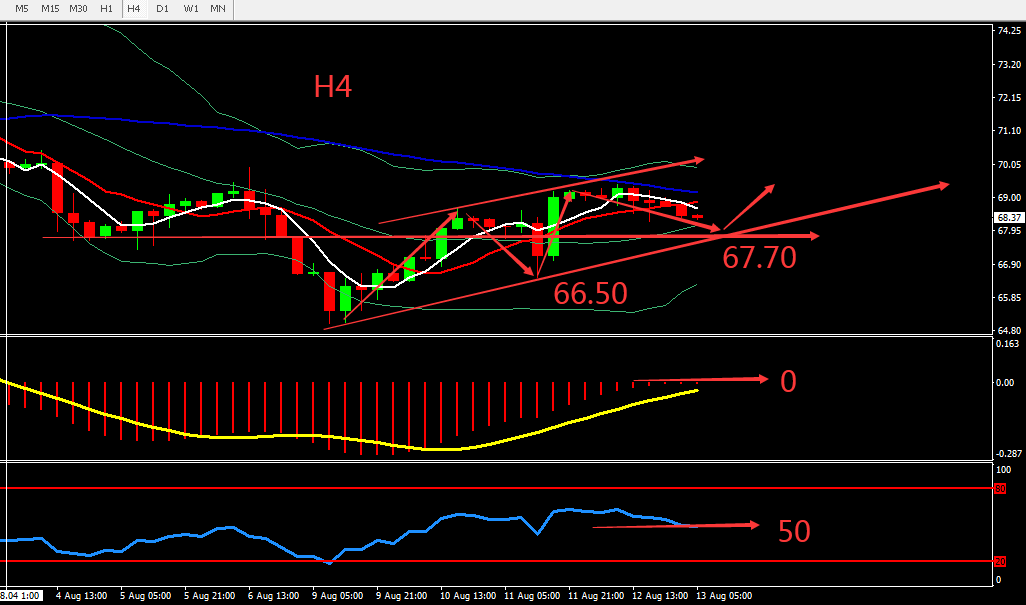
From technical perspective, yesterday crude oil still fluctuated within the intervals and closed bearish. From the pattern, there's still a chance to test the price at level 70. H4 graph shows the BOLL gradually flattened and closed in with an interval of 70-66.5. MA5 and MA10 forms Death Cross, MACD volume is at around the 0 axis, the upward momentum weakened. Overall, prioritise operation within the fluctuation on Friday. The chart below is showing the key point and the estimated trend, the deciding point whether to buy or sell is near 67.70.

Resistance:68.70-69.30-70.00
Support:67.70-66.50-65.40
This material is from Quant Tech Limited and is being posted with permission from Quant Tech Limited. The views expressed in this material are solely those of the author and/or Quant Tech Limited and BTCDana is not endorsing or recommending any investment or trading discussed in the material. Before acting on this material, you should consider whether it is suitable for your circumstances and as necessary, seek professional advice


