Market Analysis of Gold on Thursday 12 August 2021
On Wednesday, Gold moved up quickly to hit a high of US$1754.46/ounce, more than $30 above its daily low. The US CPI performance in July was basically in line with expectations, and the core CPI was weaker than expected. Market expectations of the Fed have dropped, and US bond yields are dragging down the value of the dollar. Gold prices continued their intraday gains and hit their biggest one-day gain in two weeks. In the face of economic recovery, pandemic, stock market bubbles and other risks, gold is the ideal tool to counter risk.
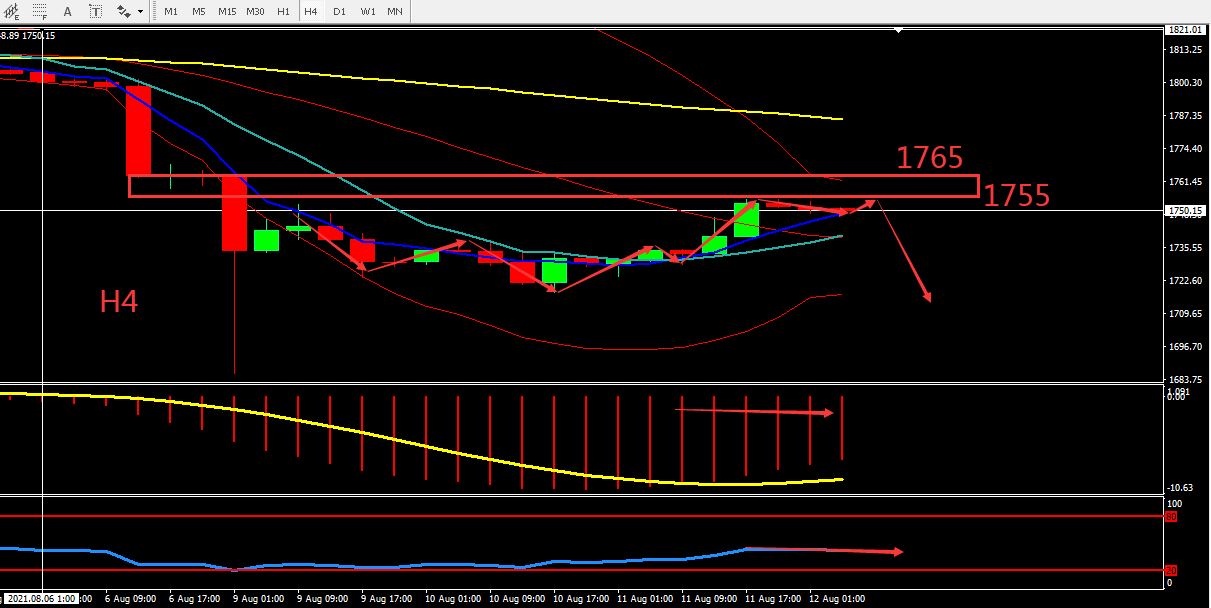
From a technical perspective, gold's daily line closed bullish, but has not yet formed bullish engulfing pattern. The point 1755-1765 is still the lowest resistance level for the short term. On the 4-hour chart, moving averages are converging, and is stable at the middle band of BOLL. The performance of the RSI is neutral. Overall, prioritize fluctuations in the fluctuation zone.Consider the support zone and resistance zone, the deciding point whether to buy or sell is near 1755

Resistance:1755-1765-1775
Support:1744-1738-1725
Market Analysis of Crude Oil on Thursday 12 August 2021
On Thursday Asia session, crude oil fluctuated around 69.10 and closed on the high-level, followed by a reversal during the session. Previously, the Biden administration stated that it would not call on US oil companies to increase crude oil production and said that efforts to urge the OPEC to increase production are a longer-term plan. On Wednesday, EIA said that crude oil inventories fell slightly last week and gasoline inventories fell to the lowest level since November last year.
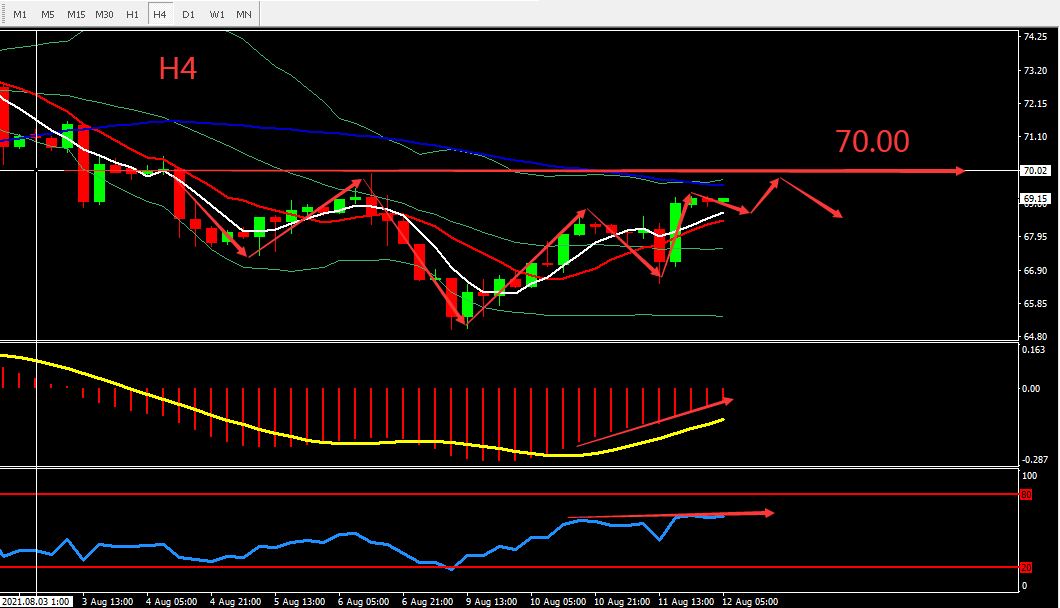
From technical perspective, the daily line close bullish. Judging from the pattern, crude oil still shows a room for price to increase. Pay attention to level 70. H4 graph shows that crude oil is still operating at around the upper Bollinger band while MACD volume dropped. The market still fluctuates within the intervals. Overall, prioritize operations with the expectation that crude oil will rise first then drop. Pay attention to today's IEA monthly report and OPEC monthly report. The chart below is showing the key point and the estimated trend, the deciding point whether to buy or sell is near 70.00.

Resistance:69.50-70.00-70.70
Support:68.60-67.70-66.50
This material is from Quant Tech Limited and is being posted with permission from Quant Tech Limited. The views expressed in this material are solely those of the author and/or Quant Tech Limited and BTCDana is not endorsing or recommending any investment or trading discussed in the material. Before acting on this material, you should consider whether it is suitable for your circumstances and as necessary, seek professional advice


