Market Analysis of Gold on Wednesday 11 August 2021
On Wednesday's Asian session, Gold strengthened slightly and traded near 1732. On Tuesday, gold prices were quite stable. The US dollar index rose to a three-week high and the US stock market hit a record high which put pressure on gold prices. The $550 billion infrastructure bill was finally passed by the United States on Tuesday. If the infrastructure bill is finally approved by both parties, then all states will benefit. The epidemic that continues to spread also supports gold prices.
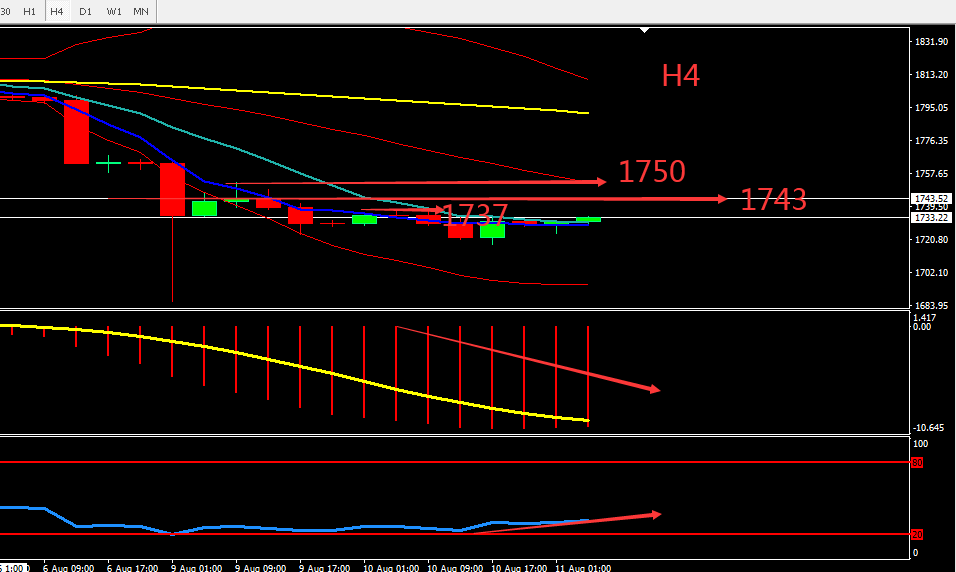
From a technical point of view, gold's daily candle was closed by Doji, and the market loses direction in the short term. The indicators show bearish signs. The 4 hours graph showed that gold dropped to 1717 then rebounded. The RSI indicator is showing signs of stabilization while the 5-day and 10-day MAs converge. Overall, prioritize operations with the expectation that gold will strengthen and then weaken. Consider the support zone and resistance zone, the deciding point whether to buy or sell is near 1750.

Resistance:1737-1743-1750
Support:1726-1717-1707
Market Analysis of Crude Oil on Wednesday 11 August 2021
Oil prices rose on Tuesday, reaching a maximum of US$68.69 per barrel, as rising demand in Europe and the United States overwhelmed concerns about the increase in new corona virus cases in Asian countries. EIA report: U.S. job growth and liquidity boosted gasoline consumption in 2021, and a slight adjustment was made to oil price expectations. API data shows that US crude oil and gasoline inventories have recorded a decline, and gasoline inventories have fallen for the third consecutive week.
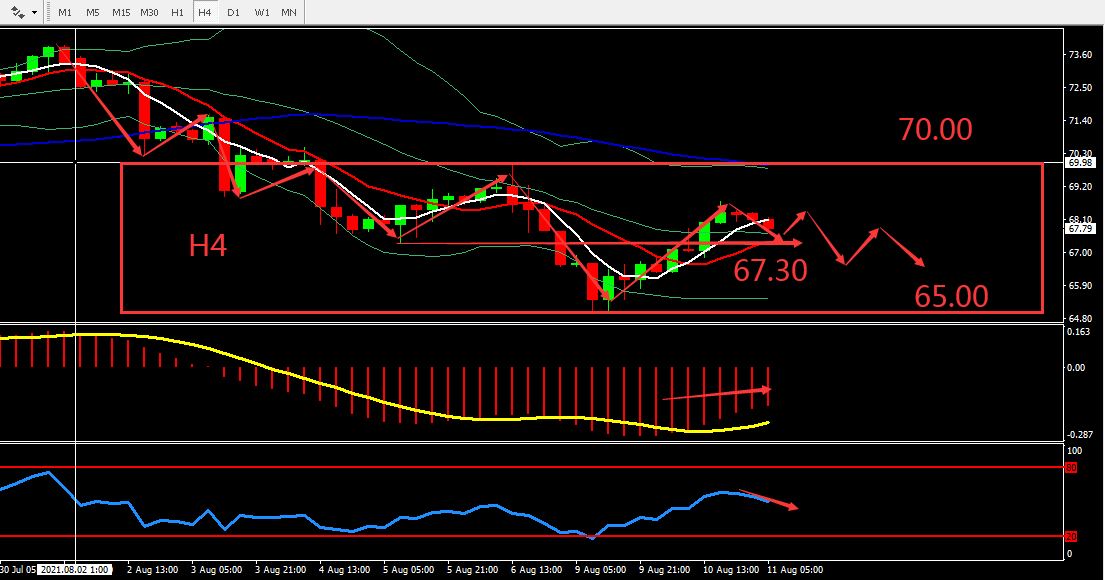
From technical perspective, the daily candle closed bullish, the candles formed an engulfing pattern, and overall indicators are still bearish. H4 graph shows the BOLL has some signs of stabilization. According to the candlestick pattern, oil prices will fluctuate within 70-65. The indicators show some signs of rebound but is still bearish overall. Overall, prioritise Sell on the high position within the fluctuation zone. The chart below is showing the key point and the estimated trend, the deciding point whether to buy or sell is near 67.30.

Resistance:68.40-69.00-70.00
Support:67.30-66.60-65.00
This material is from Quant Tech Limited and is being posted with permission from Quant Tech Limited. The views expressed in this material are solely those of the author and/or Quant Tech Limited and BTCDana is not endorsing or recommending any investment or trading discussed in the material. Before acting on this material, you should consider whether it is suitable for your circumstances and as necessary, seek professional advice


