Market Analysis of Gold on Tuesday 10 August 2021
On Monday, gold prices fell to their lowest level in more than four months. Last Friday, July non-farm data in the United States unexpectedly improved. Coupled with recent statements by many senior Federal Reserve officials who have supported the start of reductions in debt purchases over the course of the year, markets have reason to believe that the Fed could officially announce the start of debt reduction actions at public meetings in August and September. Once the Fed delivers the schedule, it will signal that the Fed has officially entered the monetary policy tightening cycle.
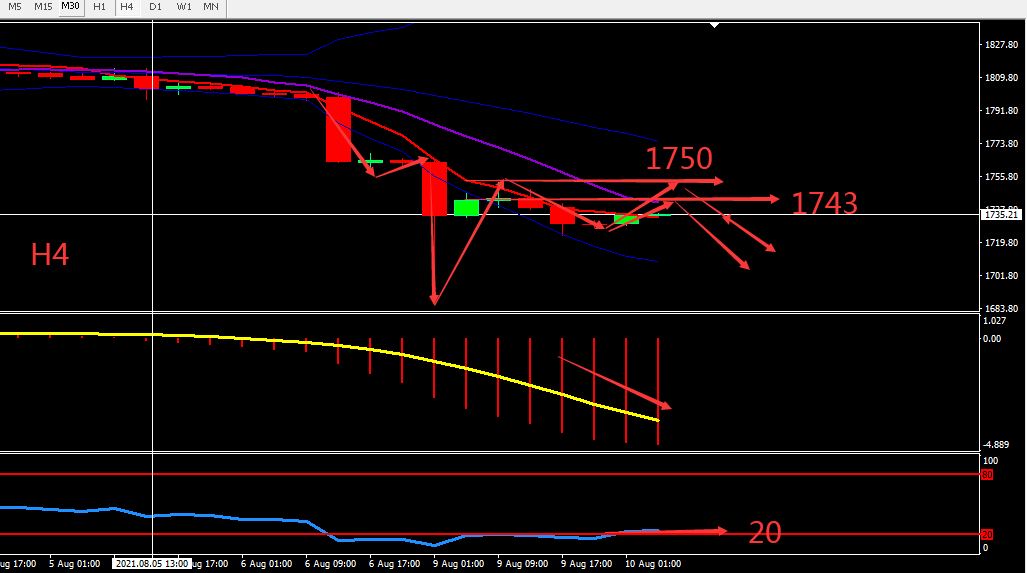
From a technical perspective, Gold reached a bottom, but failed to form a reversal V pattern, which means that the market recognizes that gold is in a downward trend. The 4 hours chart maintains a descending structure, indicators overall are showing bearish signals and no signs of rising. The bulls still have the possibility to undergo correction down to 1750. Overall, prioritize Selling at high prices within the fluctuation zone. Consider the support zone and resistance zone, the deciding point whether to buy or sell is near 1750

Resistance:1743-1750-1765
Support:1726-1717-1700
Market Analysis of Crude Oil on Tuesday 10 August 2021
On Monday, oil prices continued their decline since last week, with a decline up to 4%. The strengthening of U.S. dollar and the spread of the new corona virus around the world made the outlook for the oil market bleak. The number of new confirmed cases and hospitalizations of new corona virus in the US keeps rising, reaching the highest point in six months. The epidemic related to the delta variant virus in the entire Asia-Pacific region is getting worse.
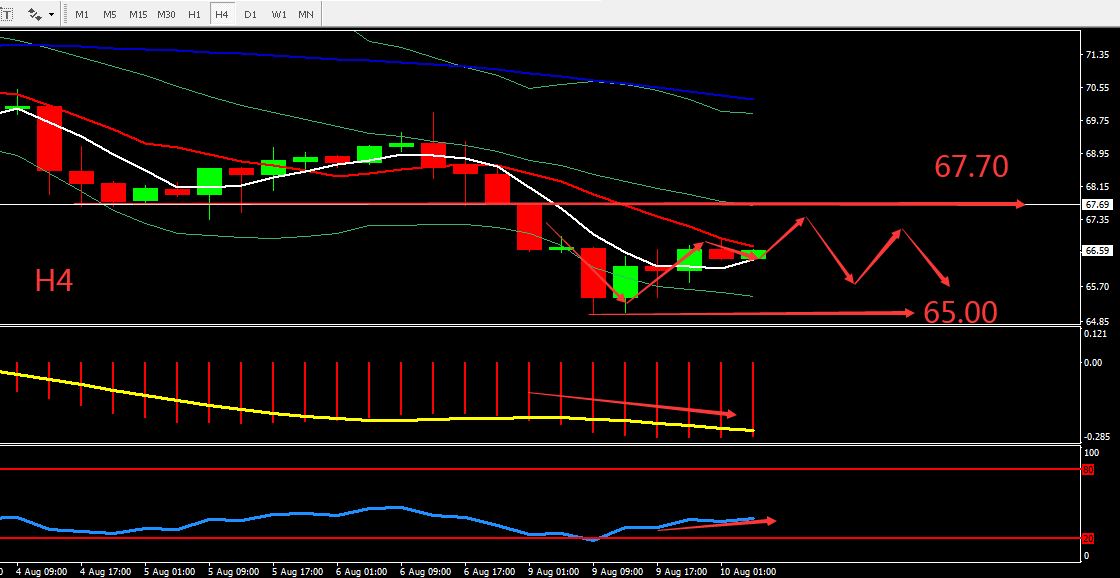
From technical perspective, the daily candles closed bearish and stop falling at level 65 as expected. The daily indicators are still weak, and the general trend is still bearish. H4 graph shows the oil prices continued to decline and was below the middle BOLL band. The 1-hour Bollinger band was flat, and the indicators tended to be neutral. The probability of oil price fluctuations in a short period of time increased. Overall, prioritise Sell on the high position within the fluctuation zone. The chart below is showing the key point and the estimated trend, the deciding point whether to buy or sell is near 65.00.

Resistance:67.00-67.70-68.50
Support:65.80-65.00-63.80
This material is from Quant Tech Limited and is being posted with permission from Quant Tech Limited. The views expressed in this material are solely those of the author and/or Quant Tech Limited and BTCDana is not endorsing or recommending any investment or trading discussed in the material. Before acting on this material, you should consider whether it is suitable for your circumstances and as necessary, seek professional advice


