NSDQ TECHNICAL ANALYSIS SHORT TERM VIEW
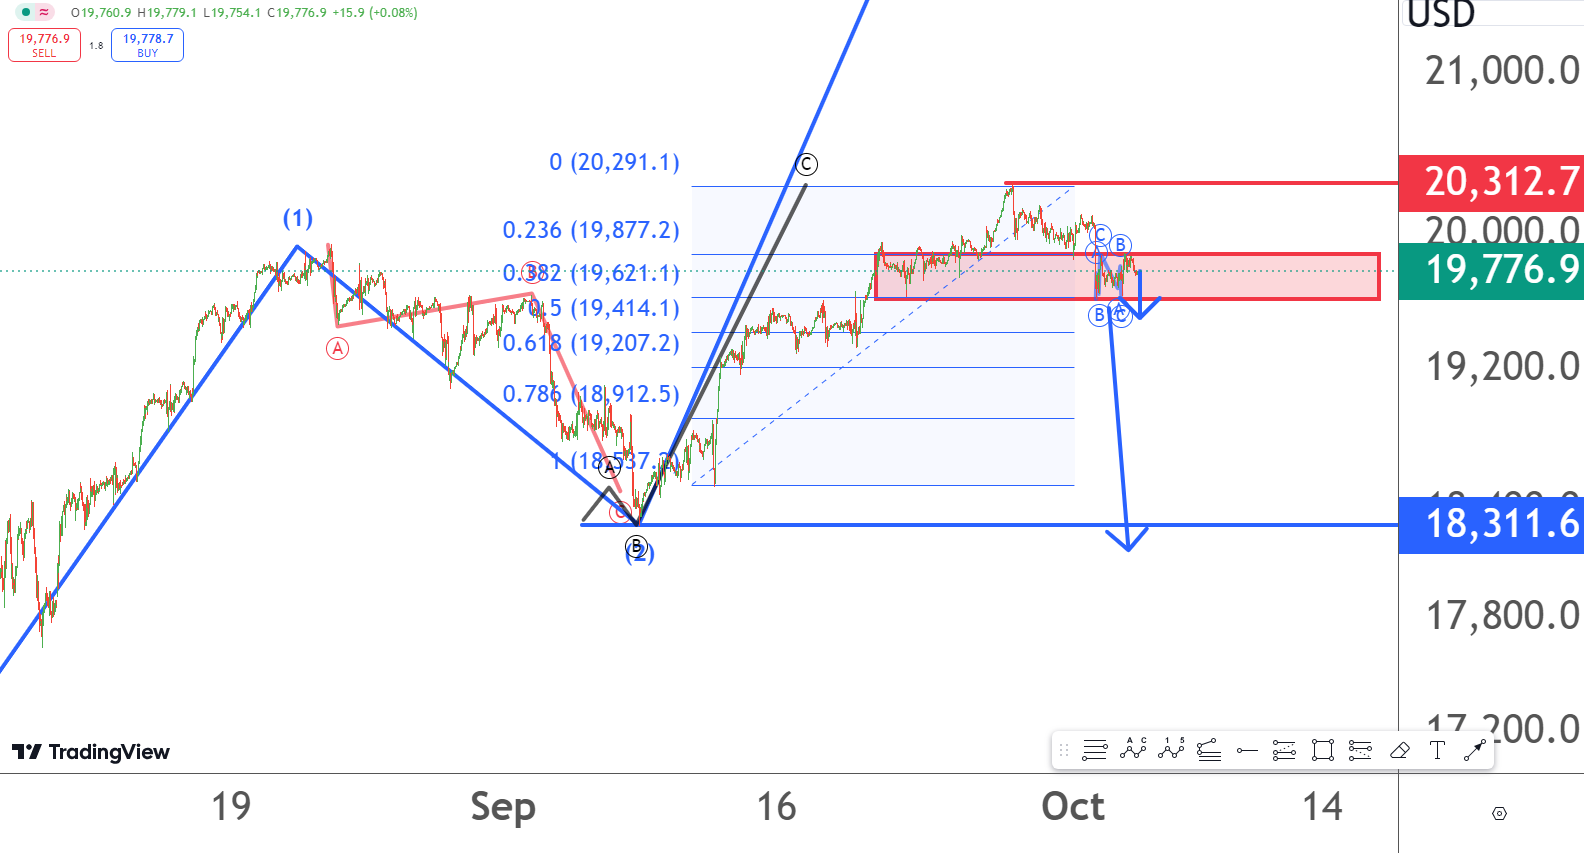
NSDQ running in negative trend and its immediate strong resistance are 19620 to 19877 level . Stop loss is 20300 level and it can fall towards 18300 level minimum because of irregular correction made on 5 minute chart .Intraday purpose selling is better for targets 19740,19710 and 19680 levels respectively with stop loss 20300 level. 5 minute chart showing double zigzag correction from 19600 level so it can fall sharply below 19600 level .
QUICK FUNDAMENTAL LOOK
Wall Street was poised for a slightly lower open on Wednesday after geopolitical tensions in the Middle East and a domestic port strike left investors nervous, while a survey allayed concerns about a rapid cooldown in the labor market.
POC = Risk is a part of trading, use caution when placing orders and take market advice only into account .