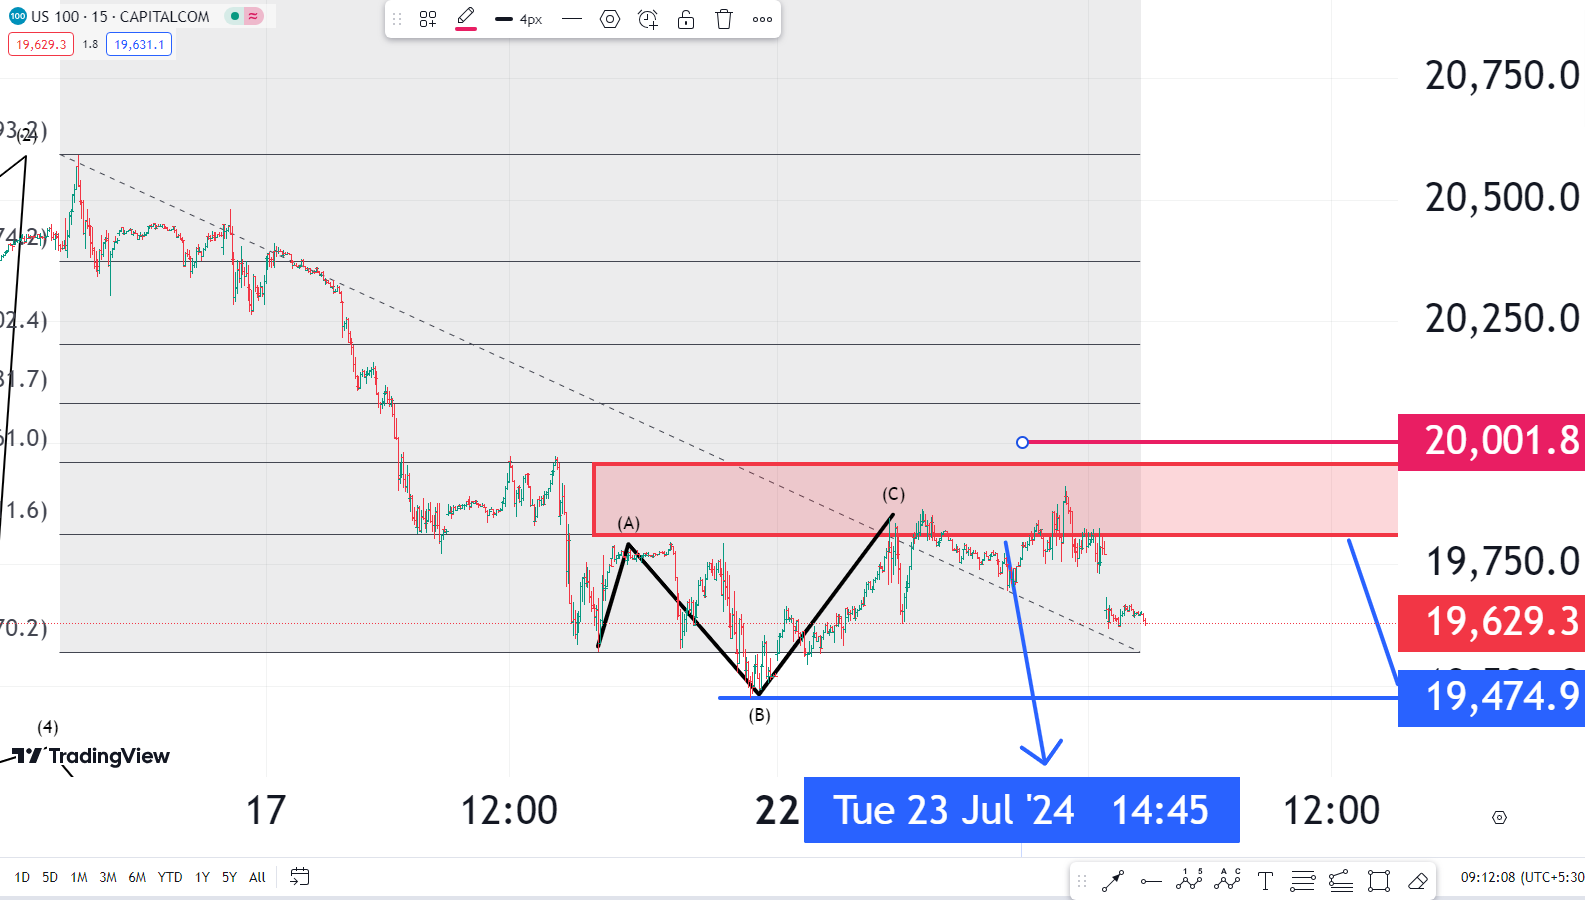
NSDQ TECHNICAL ANALYSIS SHORT TERM VIEW
NSDQ running in negative trend and its immediate strong resistance are 19800 to19960 level . Stop loss is 20000 level and it can fall towards 18700 level positionally . Intraday purpose selling is better for targets 19600,19570 and 19540 levels respectively with stop loss 20000 level . 15 minute chart showing irregular correction at level of 19475 so it can sharply fall below 19475 level in very short term .
QUICK FUNDAMENTAL LOOK
U.S. stocks were flat to higher on Tuesday as investors awaited Alphabet and Tesla earnings later in the day to gauge if the recent market rally has momentum to spare, while United Parcel Service and NXP Semiconductors plummeted after poor results.
POC = Risk is a part of trading, use caution when placing orders and take market advice only into account .


