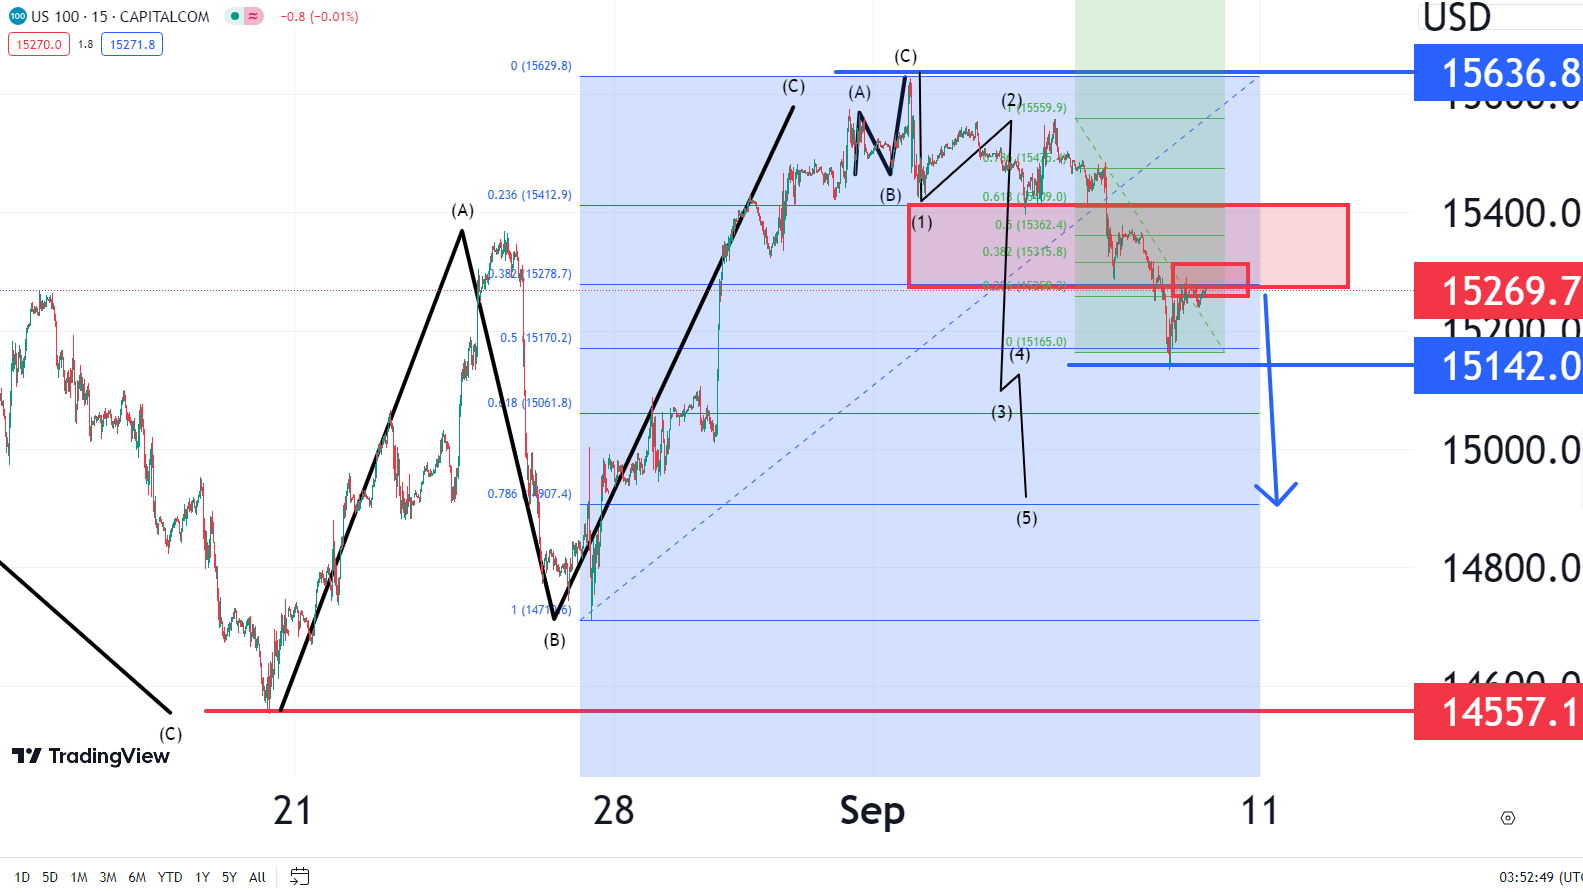
NSDQ TECHNICAL ANALYSIS SHORT TERM VIEW
NSDQ has strong resistance 15278 to 15412 levels and it can fall towards 14557 below .Selling is better with stop loss 15450 expecting downside intraday targets 15240,15220 and 15180 respectively. Calculation suggesting it should hit 14557 without touch 15365.1 minute chart suggesting resistance 15258 to 15315 and stop loss 15365 and it should decline towards 14900 level sharply.
QUICK FUNDAMENTAL LOOK
US stock market: S&P, Nasdaq fall as Apple drags, jobless claims data fuels rate jitters.Shares in S&P heavyweight Apple Inc fell for a second straight day on news that China had widened curbs on iPhone use by state employees, requiring staff at some central government.
POC = Risk is a part of trading, use caution when placing orders and take market advice only into account.


