


Have you ever noticed a stock move to an oddly low level while your indicators say something totally different? This is known as bullish divergence. It might just be one of the more powerful signals in your trading toolbox!
What is Bullish Divergence?
Bullish divergence occurs when price action and technical indicators are moving in different directions. Let us put this in a situation. You see that Bitcoin went from $25,000 to a new low of $25,000. But your MACD indicator is showing everything it can not do and showing some higher lows. This is divergence in motion. Divergences usually indicate that a reversal in price is coming soon.
Think of it this way: it is like somebody is visibly smiling but clearly upset at the same time. Even though the signal is not verbal, anything that we see is a signal and it is happening under the surface. In a trading sense price is still falling but the momentum indicator is signalling bullish already.
We will share two types that are important to see:
-
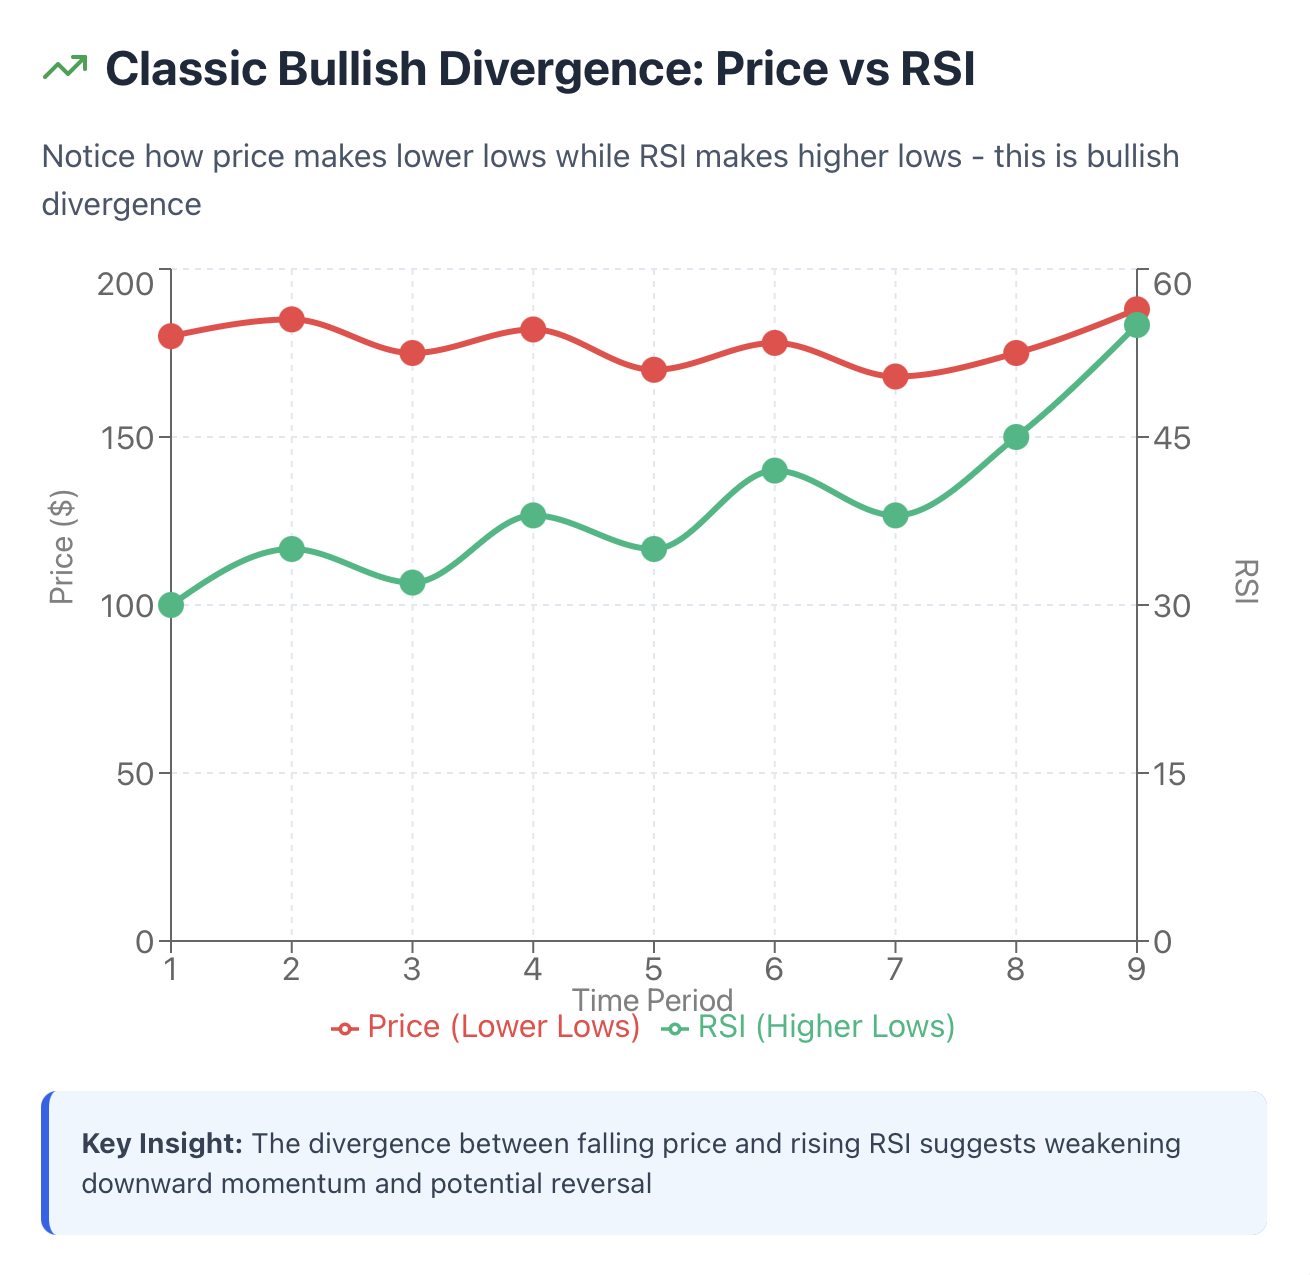
A classic divergence is an indicator that comes at the end of trends: price makes a lower low, while the RSI or MACD makes a higher low. Momentum shows loss of power and may signal price is going to reverse.
-
A hidden divergence happens inside an uptrend pullback: price makes a higher low, while the indicator makes a lower low. Momentum signals the uptrend will likely continue.
In an example to demonstrate this at a maybe beginner level: let's say that you are watching the price action of Apple stock. The price falls from $180 to $170, bounces to $175, and then falls again to $168. So, we have lower lows happening in price. Next we check the RSI, and it reads 30, then 35, then 38.The RSI is moving upward while price is declining. This scenario is textbook bullish divergence "possible reversal soon."
The cool thing about divergence is timing; because it gives you the opportunity to trade the reversal before the price actually firms up. When the trend finally does finally flip, you're already a participant in the reversal.
How to Identify Bullish Divergence Like a Pro
Identifying divergence sounds simple. You would think the line from the indicator would be a straightforward programmatic solution. When you are sitting in front of real price action and actual charts it is not so simple. Here is the way to do it correctly.
Pull up a price chart with MACD on the chart or RSI on the chart. Then look for at least two price lows and draw a horizontal line connecting those lows on the price chart. Then, you will do the same with the indicator; look to see if you can draw a line connecting the indicator highs or lows. It is a bullish divergence if the price oscillator line is sloping down but the oscillator line is hugging an upward slope.
Now, you will want to really confirm by looking at multiple different timeframes. A daily chart divergence is better than a 5-minute divergence. I usually look at the daily, and then drop down to 4-Hour or 1-Hour to confirm.
Let's work through a real life trading scenario. On a 4-hour chart for EUR/USD; price fell from 1.0850 to 1.0800 and had a little rally to 1.0820. Then the price dropped again to 1.0780 for a lower low. MACD readings were, -15, -10, -8 during those lows. The MACD is increasing as the price is dropping. The signal was there.
Different indicators will give you different views of the divergence. MACD shows shifts in momentum and is an excellent indicator for swing trades. Whereas, RSI, checks for price bounces when oversold and is good for shorter timeframes.The stochastic oscillator is highly sensitive and detects divergences very early, although it can ultimately be inaccurate during strong trends.
For beginners, you can experiment with this on a blue-chip stock, like Apple. On a daily chart, simply focus on the two most recent price lows. During the same timeframe, check whether the RSI is making higher price lows against the most recent price lows. If it is, you're potentially looking at bullish divergence. When you see this happen, wait for the price to break above a recent swing high before you consider entering.
The key is patience- that is, the divergence will be forming over a matter of days or weeks, not minutes. Multi-timeframe confirmation markedly increases your probability. If you see divergence on daily, 4hr, and 1hr charts promptly, now, you are looking at a high probability set up to enter a position.
Why Market Context Matters for Bullish Divergence
What most traders miss, is that bullish divergences don't work the same in every market context. The context matters.
In a strong downtrend, bullish divergence will maybe give you a small bounce before the price continues on its path down further. Think of the bullish divergence as a small pause, and not a reversal. In a sideways or consolidating market. the bullish divergence may lead to a larger rally.
For example, bitcoin. During a bear market in 2022, BTC had some bullish divergences in the price range of $20,000 to $25,000. Many of them worked for around a quick 10-15% bounce, while a total of 0-100,000% others didn't do anything because the broader market was still concentrated in a negative trend. Fast forward to the 2023 more stable volatile consolidation. The same divergences were happening again to lead several rallies of 30% or more again toward 2023 price levels near 2022 before any serious bear levels we saw in them prior.
Macro matters.If the Federal Reserve is raising interest rates like there is no tomorrow, any bullish divergence in growth stocks can easily get crushed by selling pressure. But in a rate-cutting or cooling inflationary environment, the technical signal has more weight.
For equities, you first want to pay attention to where the overall market is. Do you see a bullish trend in the S&P 500? Is it falling into major support? Bullish divergence for an individual stock works much better when it does not have the overall market against it.
More advanced traders will use divergence signals along with sentiment indicators. If retail traders are massively bearish (high put/call ratios, negative sentiment surveys) and you have a bullish divergence signal, that is often a big risk/reward contrarian signal. Everyone has already sold and the technical set up suggests buyers are entering.
The Nasdaq index is an excellent case study. During bull markets there is a tendency for bullish divergences to work incredibly well near the 50-day moving average at pullbacks. During bear markets, those same signals near MA's often fail. What is the difference? Market context.
As a take away, always ask yourself what kind of market you are in before acting on divergence. The signal is the same, but there are materials and environmental reliability differences.
Pairing Bullish Divergence With Other Indicators
Do you want to take your divergence trading to another level? Pair it with other technical analysis tools.
Divergence and Moving Averages is a powerful combination.Identify bullish divergence, then simply wait for price action to trade back above the 20-period or 50-period moving average. This will validate that momentum is indeed shifting. You may see the MACD divergence on EUR/USD at 1.0750, but you will not act until price action breaks back above the 50-period EMA at 1.0780. The moving average is simply a confirmation of trend.
Taking divergence and the Bollinger Bands will allow you to identify potential entries with precision. If price action touches the lower band and is exhibiting RSI divergence, then you are buying at a price support area and have the technical confirmation to prove it. As an example, consider that Apple has fallen to $165, touches the lower Bollinger Band, and shows RSI divergence. This aligns support with being oversold and with momentum shifting back in your favor. That gives you better odds than the divergence alone.
Taking divergence and volume allows you to differentiate if the signal is real or fake. Unless volume is dead, bullish divergence means nothing. If you observe the divergence forming and increased buying volume increases after price has charged to the upside, this will validate that buyers are coming into the market. When the price is trading to the upside after the divergence is formed, observe increased volume of at least 50% above the most recent average volumes in that section of price action.
Here is a professional setup; you observe MACD divergence on Tesla somewhere in the $210 area. Price is making lower lows, while the MACD indicator is not. Now, check the 200-day EMA that happens to be located around $215. In this case, you simply wait for price action to break above $215 (the EMA) with increased volume. Your stop would go either below the recent low at $208. The target would be the next resistance zone near $230. In this setup, you are combining the MACD divergence, the trend confirmation indicated by the moving average, and volume with intention into one trade.
For beginners to get started, keep it simple; find RSI divergence and then check if price action is near a Bollinger Band. If the lower Bollinger Band and divergence signal align, then you have a pretty decent trade entry based on support. Your stop loss would go just below the band and you would take profits at the middle band when price action moves.
Using any indicator in combination with another as a trading strategy does not guarantee the win, but it will help you better filter away the low probability setups. You are looking for one confluence, where multiple signals indicate to move in the same direction of the trend. That is how you earn higher accuracy trading divergence.
Real-World Examples of Bullish Divergence
The theory is nice, but now let's examine some real trades that happened.
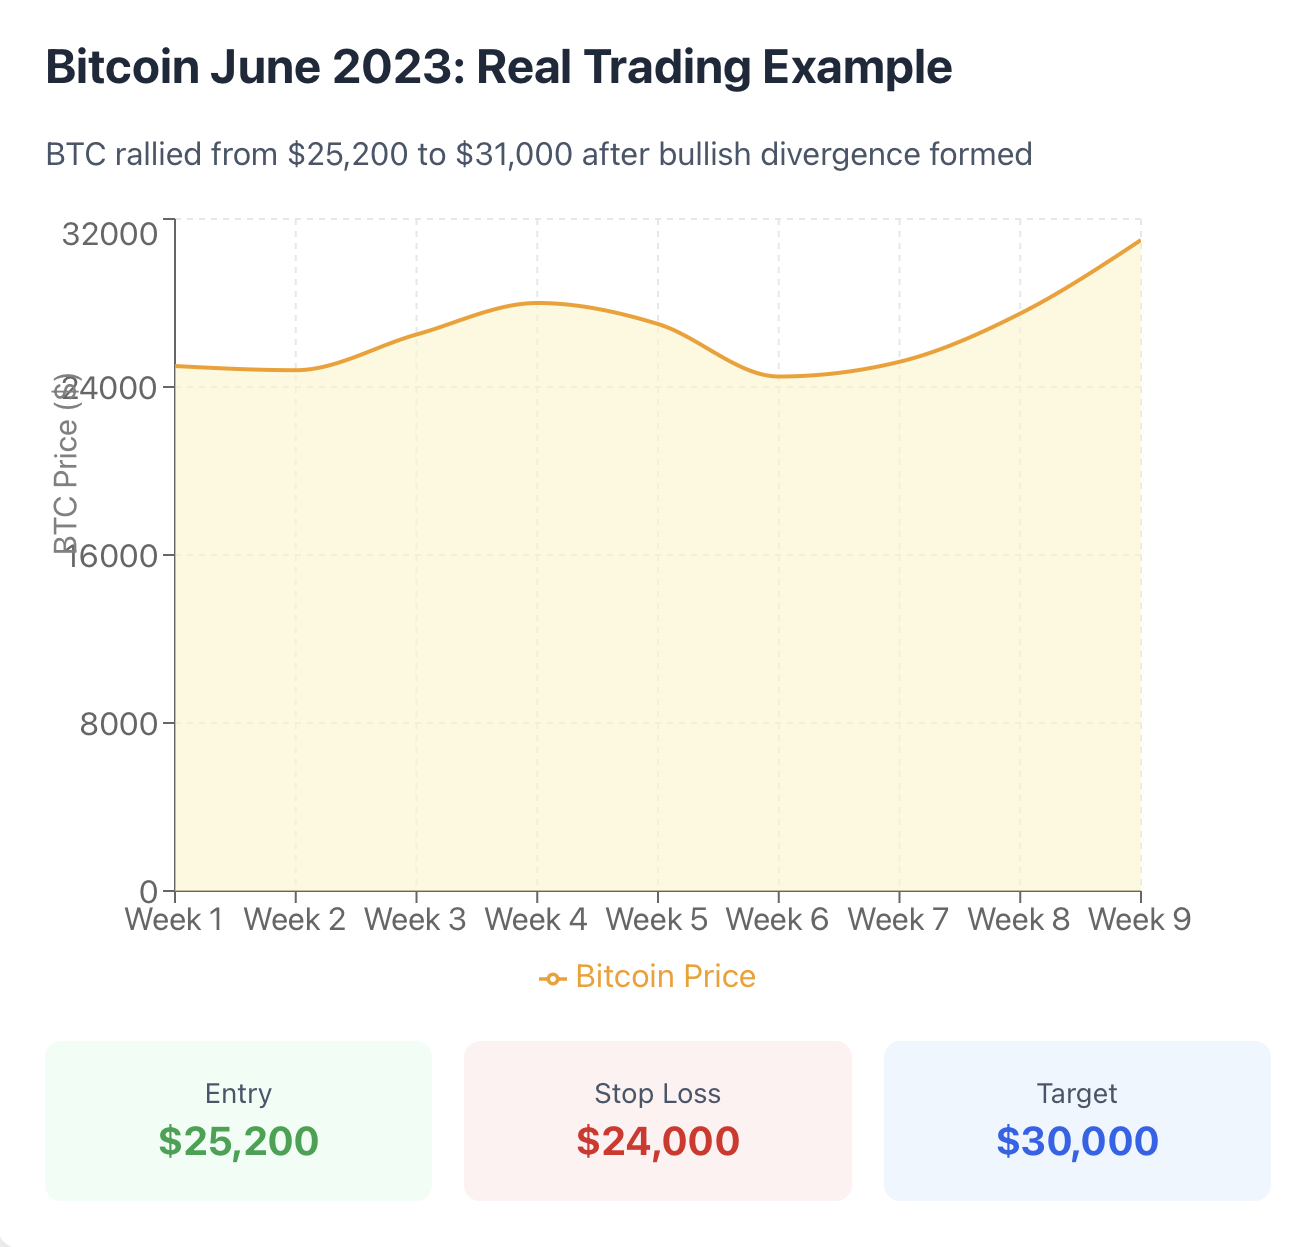
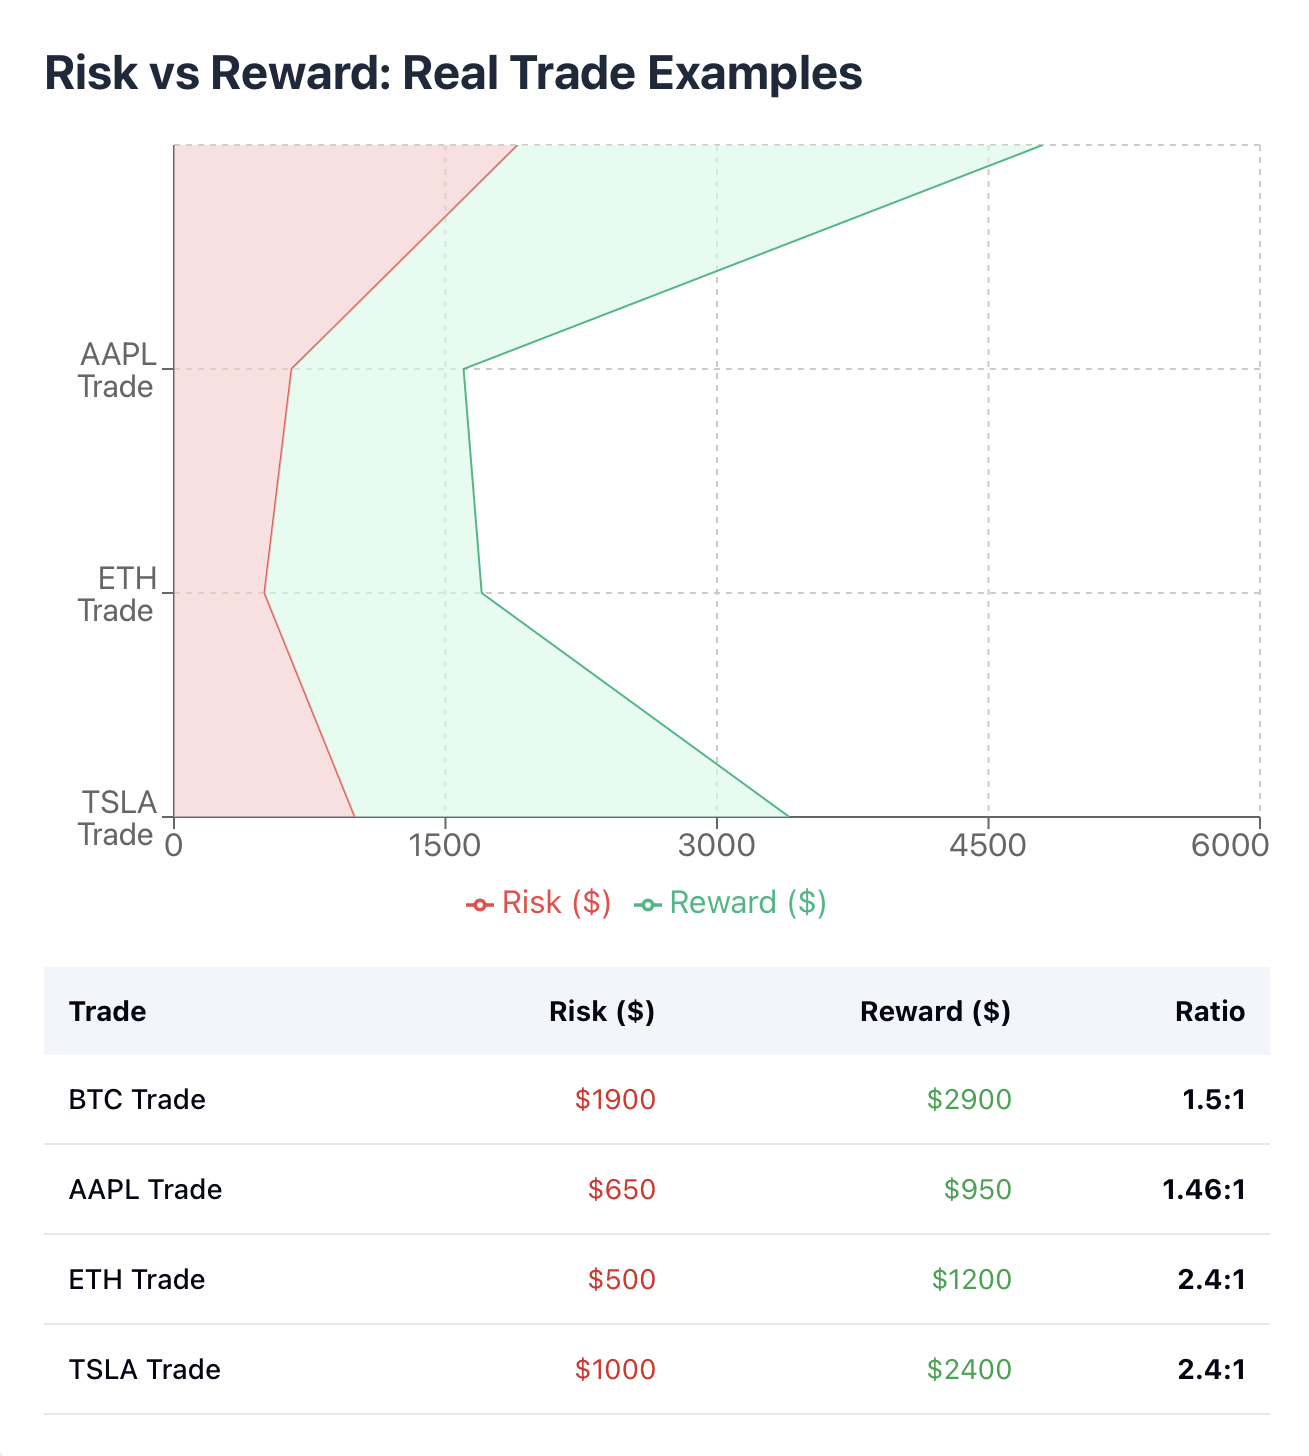
Bitcoin (BTC/USD) - June 2023: BTC had a low of $24,800, moved up to $28,000, and then fell back down to $24,500. Prices made lower lows. But the RSI showed 28, then 35, then 38. We had higher lows on the RSI even though prices made lower lows. The classic bullish divergence occurring at the first support we identified was in play. Traders gave the buy signal after BTC traded in the $25,000 area, and over the next month, BTC rallied to $31,000. Entry at $25,200, stop at $24,000, and target at $30,000 gives the trader better than 4:1 risk-reward.
Tesla (TSLA) - April 2024: TSLA traded from $180 to $165, snapped back up to $172, and then traded down to $162. Prices made lower lows. The MACD histogram showed -3.5, then -2.8, then -2.0. The divergence formed over three weeks of trading in the daily chart. Price traded above the 50-day moving average at $170 with volatility increasing to 60% above average. Entry was at $171, stop was $161, and target was $190. TSLA traded up to $195 within six weeks (less than 3-to-1) returns on the trade.
Ethereum (ETH/USD) - September 2023: ETH traded from $1,680 to $1,550, moved back to $1,620, and then traded down to $1,530. Again, clear lower lows. The RSI showed 32, then 38. then 41. The bullish divergence occurred at the horizontal support level in play from earlier. Entry at $1,560 after price traded up from the lower level, stop at $1,510, and target at $1,680, gives a rewarded (better than) 4:1 risk-rewards. ETH rallied to $1,720 over the next five weeks.
Do you see a pattern? In each of these scenarios, the divergence played out over multiple price swings, and trades entered on confirmations (price breaking a trend line, or moving average), not on the lower low price point. Stops were placed below a support level. Targets were near former resistance levels or planned on a round number.
The key point is that divergence gives some time before a signal confirmation, however, always wait for trade signals after proper confirmation. Waiting for that initial breakout or moving average cross keeps you out of fake signals.
How to Trade Bullish Divergence Step-by-Step
Let’s turn signals into actual positions you can take.
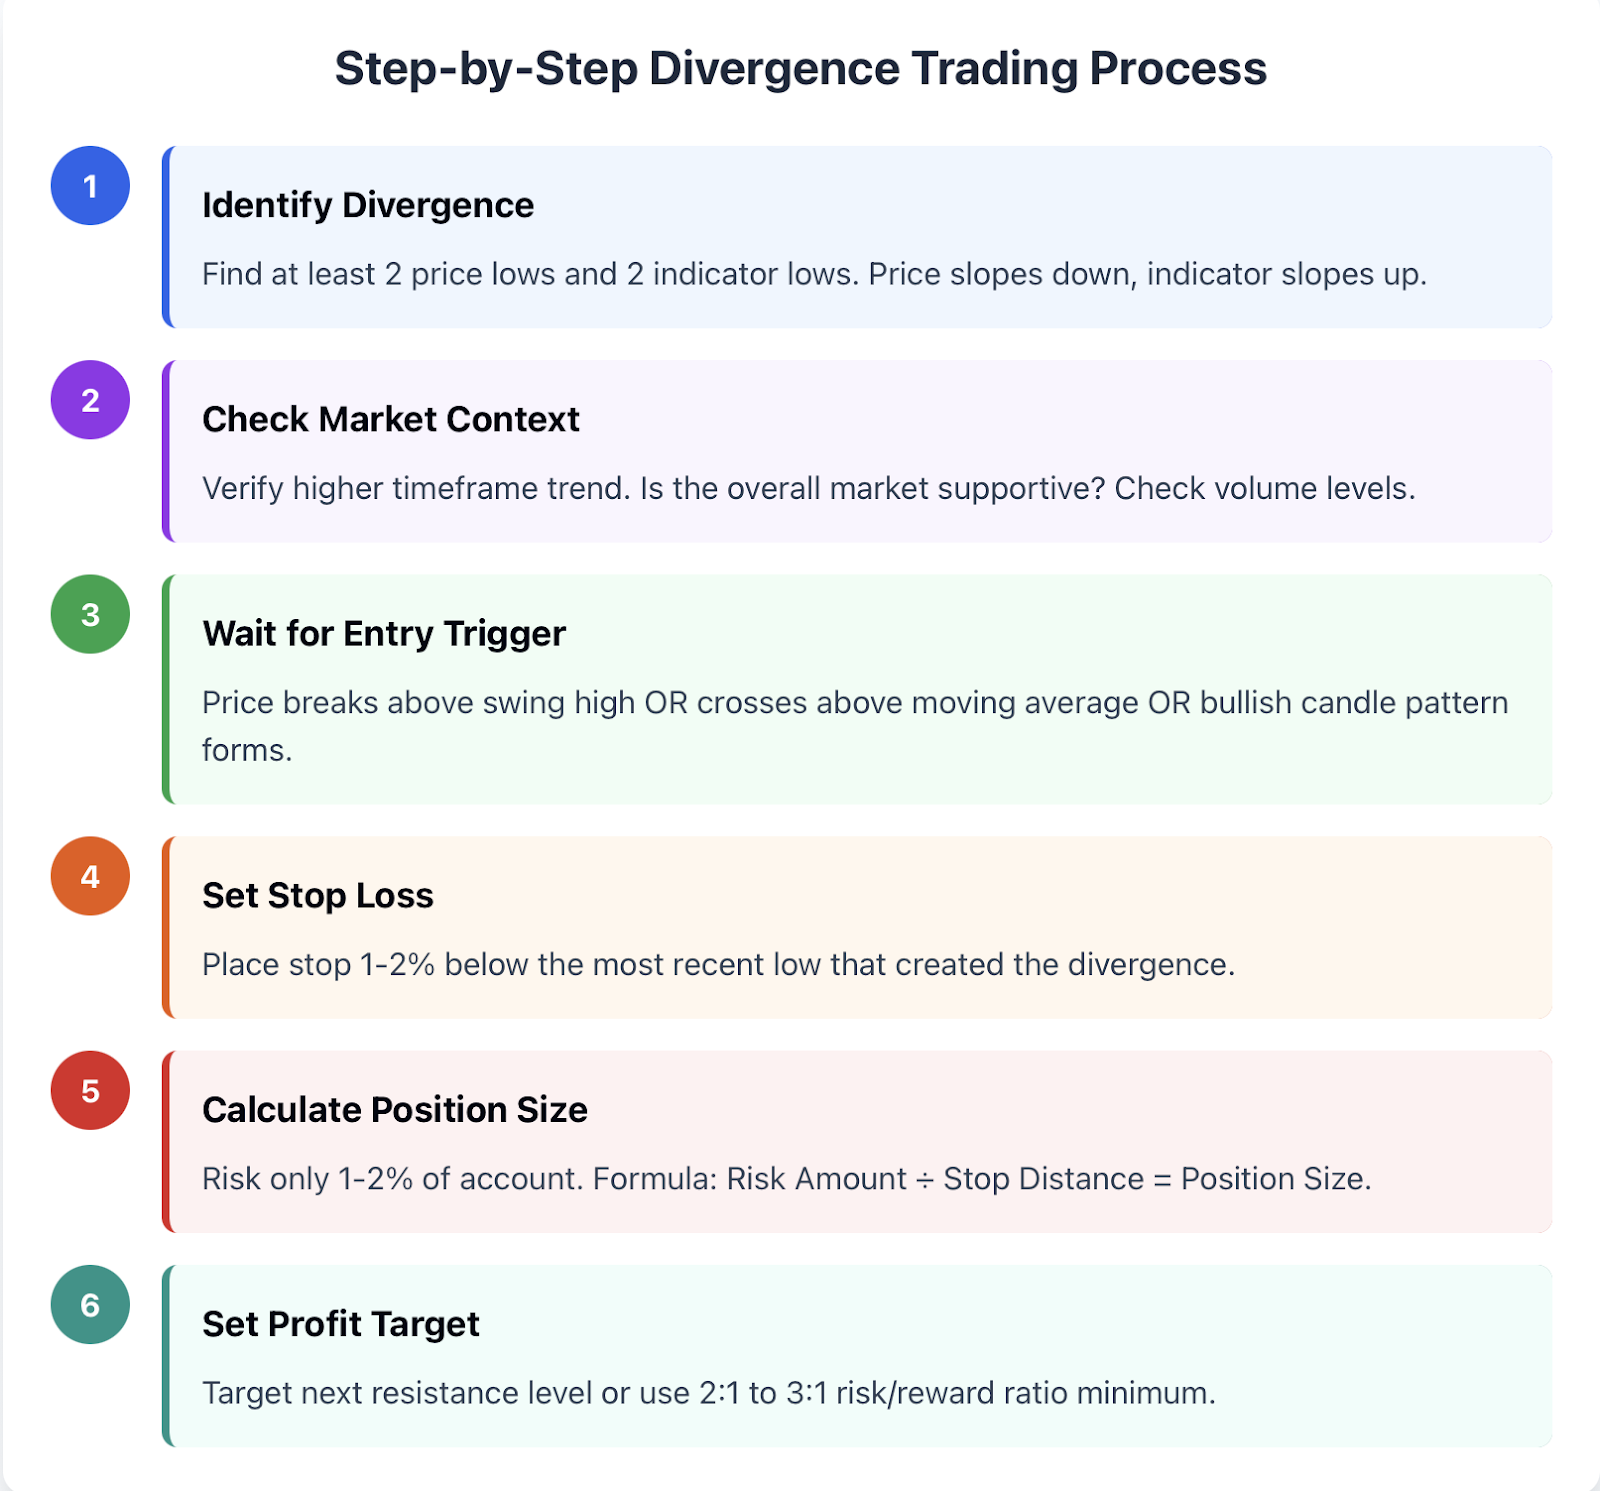
Step 1: Establish the Divergence. Make sure to have at least two price lows and two indicator lows. Draw trend lines on both. The price line must slope downward and the indicator line must slope UPWARD. If both lines slope in the same direction, you do not have divergence.
Step 2: Wait for Entry Trigger. Do NOT jump in at the lowest low. Wait for price to break above a recent swing high,or cross above a key moving average, or show a bullish candlestick pattern like an engulfing candle.This is the actual confirmation the reversal is beginning.
Step 3: Place Your Stop-Loss. Place your stop below the most recent price low that created the divergence. Add a small buffer (maybe 1 or 2% below that low) just in case the price moves down to your stop just quickly as a wick on the lower timeframe. It is in place to protect you if the divergence fails.
Step 4: Set Your Target. The target should be priced at the next major resistance level or previous swing high. Or you can use a risk reward ratio of at least 2 or 3 to 1. If your stop is $10 dollars from your entry, your target should be at least $20 to $30 from your entry. Remember not to be too greedy on the first move.
Real Setup: BTC/USD Daily Chart
Divergence forms: Look for BTC to drop to $26k (low 1), rallying to $28k dollars and dropping to $25.5k dollars (low 2) while your MACD indicates higher lows.
Entry Trigger: The price breaks above $27k (previous swing high) while observing strong or significant volume.
-
Entry Position: $27.1k dollars
-
Stop Loss: $25.2k dollars below divergence low with buffer
-
Target: $30k dollars which is the next resistance level.
-
Risk: $1900 dollars, Reward: $2900 dollars, Ratio: 1.5:1.
-
Beginner Setup: Apple (AAPL) Daily Chart
Divergence Forms: Price drops to $165 (low 1) bounces up to $172 and drops back down to $163 (low 2) while RSI makes an indicator with higher lows.
-
Entry Trigger: The price crosses above the 20 day moving averages at $168 dollars.
-
Entry Position: $168.5 dollars
-
Stop Blows: $162 below the divergence low.
-
Target: $178 dollars next resistance.
-
Risk: $6.5 dollars, Reward: $9.5 dollars, Ratio: 1.46-1
Remember to always use limit orders near one trigger point. Market orders can be wildly slippy ruining your risk reward ratio. If the price just runs away from you without you, you just have to let it go. There are always numerous setups coming down the line.
Risk Management & Position Sizing
Even the most ideal divergence signals can lose, which is why position size is more important than whether you're right or not.
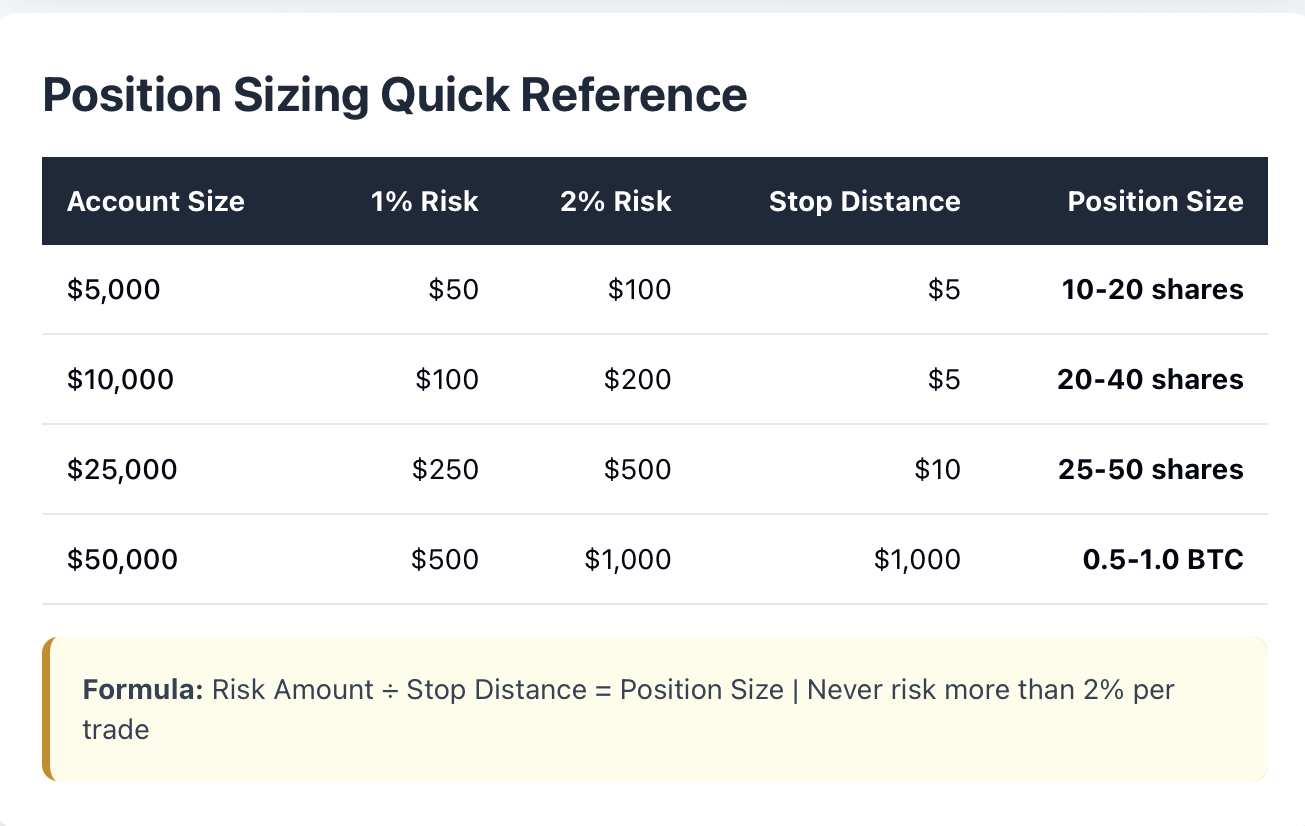
The 1-2% Rule: You should never risk more than 1-2% of your total trading capital on a divergence trade. If you have a $10,000 account, this means risking $100-$200 per trade. If your stop is $5 from your entry, this means you can only take 20-40 shares (at 1% risk).
The formula is Risk Amount / Stop Distance = Position Size. So, if your risk amount is $100 and your stop distance is $5, the maximum position size is 20 shares ($100 / $5).
Scaling Entries: Instead of going all-in on a single entry, split your entry into half. Maybe you enter half at a break of the swing high, and then add the other half at break above a moving average or key level. This allows you to avoid being taken out of the trade on volatility, especially right after the price broke the swing high.
Maximum Loss Per Day: Take a 3% stop loss for the day. If you take 3% losses of your trading capital, stop for the day and put it away until tomorrow. Emotional trading after losses is likely to lead to larger losses.
Professional Example: Assuming you have a $50,000 trading account for BTC/USD and your stop is $1,000 away from your entry. This means your risk amount is $500, which is 1% of your total account. This would make your position size equal to 0.5 BTC ($500 / $1,000 stop distance). If BTC is priced at $27,000, you would be putting $13,500 into the trade, and only risking $500.
Beginner Example: If you have a $5,000 trading account, and are risking 2% on AAPL, and your AAPL stop is $6 from your entry, then your risk amount is $100 (2% of $5,000). This means your position size is 16 shares ( $100 / $6 stop distance). If AAPL is at $168, you would have an investment of $2,688 and risk of $100.
Proper position size ensures that a string of losses will not ruin you, and a series of winning trades will help you compound your investment capital. You should keep track of all of your trades in a journal. Record the entry, the exit, your stop loss, your target level and whether the divergence trade set up was confirmed by other indicators. After tracking about 20-30 trades, you will begin to see patterns in what works for you.
Common Mistakes Traders Make with Bullish Divergence
Let's discuss what happens when things don't go right, and how to avoid repeating the same mistakes.
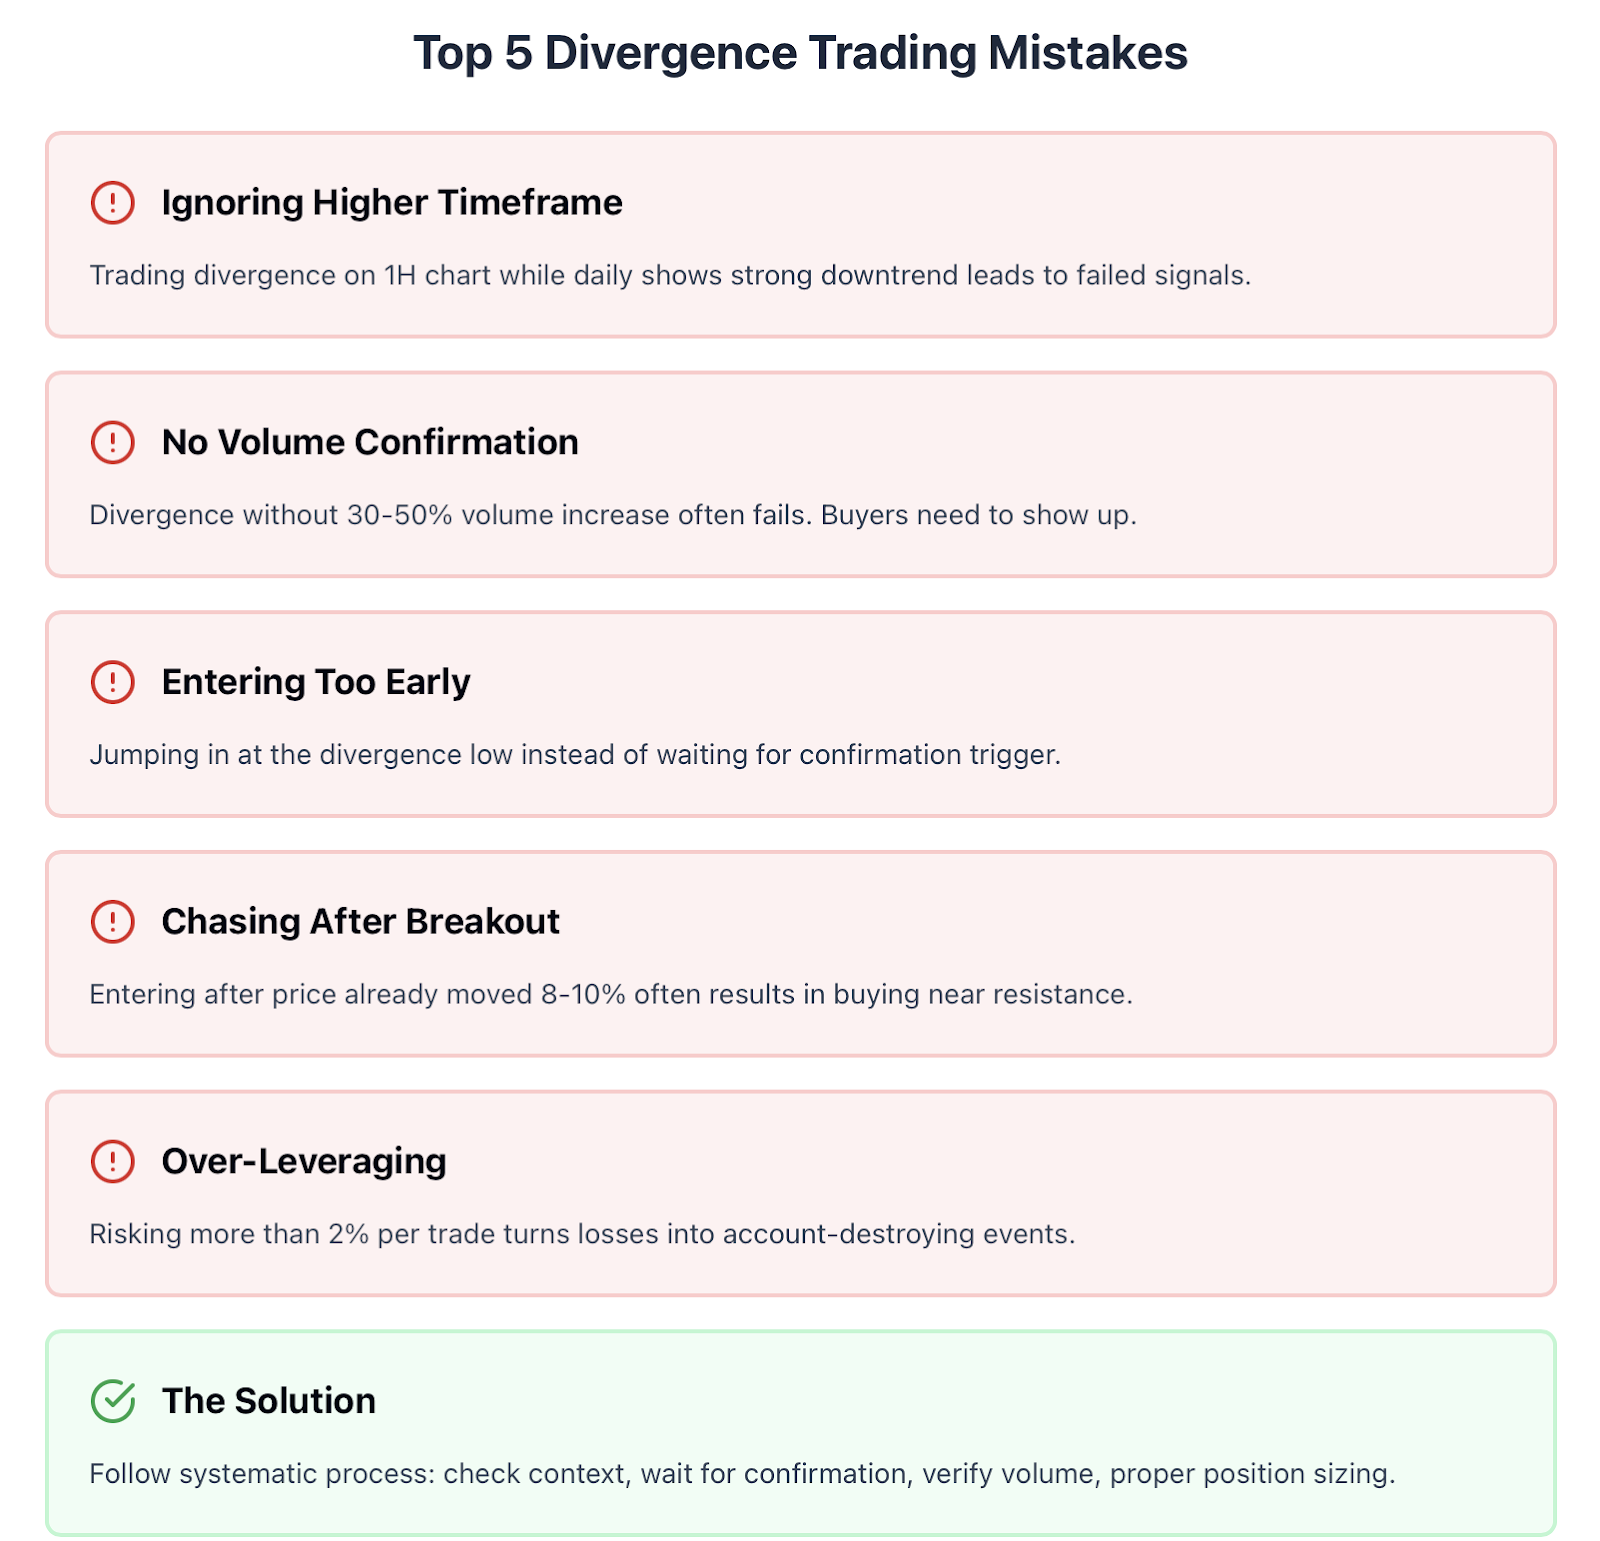
Mistake 1: Ignoring the Higher Timeframe Trend You notice an absolutely perfect RSI divergence on a 1-hour chart, but on the daily chart there is a very pronounced brutal downtrend. You enter the trade anyways. Price gives 1 quick bounce, and then fumbles to the downside once again. Always start with a higher timeframe. If the daily trend (or whatever timeframe is the biggest) is trending sharply down, then your divergence on the smaller timeframe is probably just a small correction.
Mistake 2: No Volume Confirmation You are looking at a beautiful divergence you like, you buy it, price immediately moves up 2%, and then it cracks straight down after that. Why? Because there is no volume. Buyers were NEVER in the market. If price is going to confirm the divergence and actually change its trajectory, volume must take up by at least 30-50% as price breaks to the upside. If volume does not take up, there is not going to be any conviction in the move, so skip it.
Mistake 3: Entering Too Early This mistake kills more traders than anything else in divergence trading. The divergence is forming, you jump in right away at the first low and think to yourself that you are getting the best price. But then the price drops another 5-10%, before it finally reverses and you can get profitable on the trade.
“Always wait for the confirmation.” Wait for the price to clear a swing high or clear above a moving average. The few percentage points you think you are losing (by "getting the best price") will give you massive peace of mind NOT to take huge losses or cut the trade short because the divergence fails.
Real Example of Failure: Bitcoin back in November 2022. Bitcoin formed perfect (and textbook) MACD divergence at $17,500. Price continued to make lower lows while MACD was making higher lows. Every person who jumped in right at $17,500 watched their trade lose another $200 in the space of a few days before the next actual bounce started. The traders who waited for confirmation (a clear move above $18,000) were able to avoid losing $2 more to the downside with an 11% drawdown.
Mistake 4: Chasing after the Move Has Already Started You have missed your entry. For whatever reason you weren't able to buy, and now the price is already up 8%. You convince yourself that price still has more upside. You jump into the trade near resistance, only for price to immediately reverse against you. Whether over some time or overnight, you missed the setup and let it go. Do not chase it. This scenario should repeat itself and you will get the next pullback to get in, and/or have a new divergence form again.
Stock Example: Apple stock displayed RSI divergence at $163 in April 2024. A proper entry was around $168 when price cleared the moving average. Some traders probably did not notice until AAPL hit $175, then out of FOMO now bought Apple stock at market price because they missed the divergence. The stock price immediately pulled back to $170 within days of that price point, stop-lossing them. Discipline will always beat regret.
Mistake 5: Over-Leveraging Because you are thinking to yourself the divergence is a sure thing, you might risk 5-10% of your account on 1 trade. It does not work, now you are down substantially from the recent stop-loss and now you are trading with anxiety to "make it back". Only risk 1-2% of your account size with every trade you make. No signal is worth it.
What is the solution to all of the above mistakes mentioned? A systematic process to trade divergence. Always confirm the trend context, always wait for confirmation, volume needs to take up each time position. Position sizing needs to be respected and never chase the market or any opportunity. Trading divergence for profit is as much a discipline game as it is an effective technical skill.
Are You Ready to Put Bullish Divergence to Work? You have the knowledge. Now it is time to take a step back to observe real live market charts and start to work on the verified time frames to take probable setups that other traders miss.
You are welcome to open an account with btcdana.com today and can access great real time charts/ timeframes with built-in scans including MACD, RSI, and divergence tools at no cost. Then simply just paper trade an actual divergence set-up risk-free as you learn the price action behaviors, and then scale into live positions as you become more comfortable.