


When faced with a chart filled with indicators, trading can become uneasy. But what if there was one system that displayed trends, support, resistance, and entry signals simultaneously? The Ichimoku Cloud is that system.
Started in the 1960s by Japanese journalist Goichi Hosoda, the Ichimoku Cloud is not a simple technical indicator. It's a complete trend analysis system and is used by traders across forex, crypto, and stock markets. The name Ichimoku Kinko Hyo means "one glance equilibrium chart," and that's the point. You can analyze market conditions in one glance.
What is the Ichimoku Cloud?
Most indicators tell you a single thing. Moving averages create trends. RSI creates momentum. Support and resistance lines create price levels. However, Ichimoku is one visual system that displays all of them.
The cloud (Kumo in Japanese) is the center piece of the system. It is the shaded area you will see. The cloud serves as a dynamic support and resistance zone on the chart. When the price is above the cloud you are entering into a bullish trend. And, below the cloud, you are in a bearish trend.
However, the cloud is just one aspect of the Ichimoku Cloud. The complete system includes:
-
Tenkan-sen (Conversion Line): fast moving line that quickly reacts to price
-
Kijun-sen (Baseline): slow moving line that confirms trend
-
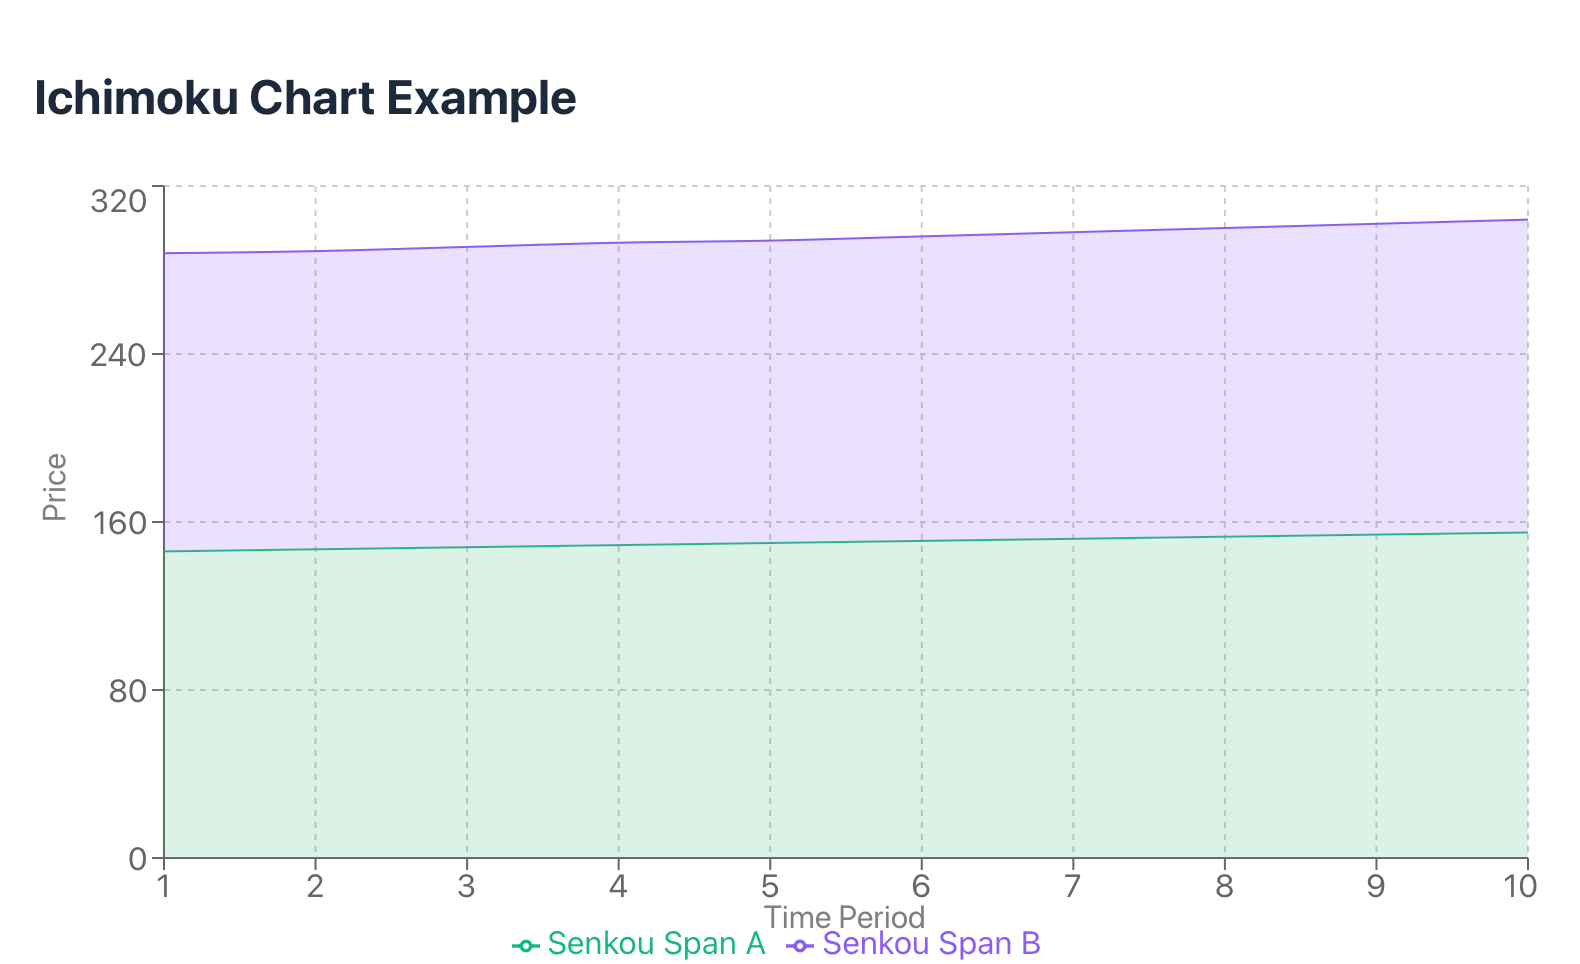
Senkou Span A and B (these create the boundaries of the cloud).
-
Chikou Span (Lagging line): indicates past price action to confirm the current signals.
Use your vision like a ball rolling on a slope.When the ball (price) rolls up through the cloud, gravity is pulling it up, which means it is in an uptrend. Below the cloud, gravity is pulling it down. The thicker the cloud, the more powerful that gravitational force is.
An Overview of the Components
Time to get specific on each line and what it does. Tenkan-sen is calculated the same way as Kijun, but it's calculated over the previous 9 periods, and it reacts quickly and quickly recognizes the new price action. Traders will watch for four times crosses above and below each line to look for quick signals that show momentum is changing.
Kijun-sen is calculated the same way as Tenkan-sen but over a 26 period time frame, making it slower and much more reliable in confirming a trend is important. When Tenkan-sen crosses above Kijun-sen, it produces a bullish signal called a Golden Cross. When it crosses below it is called a Death Cross, which is a bearish signal.
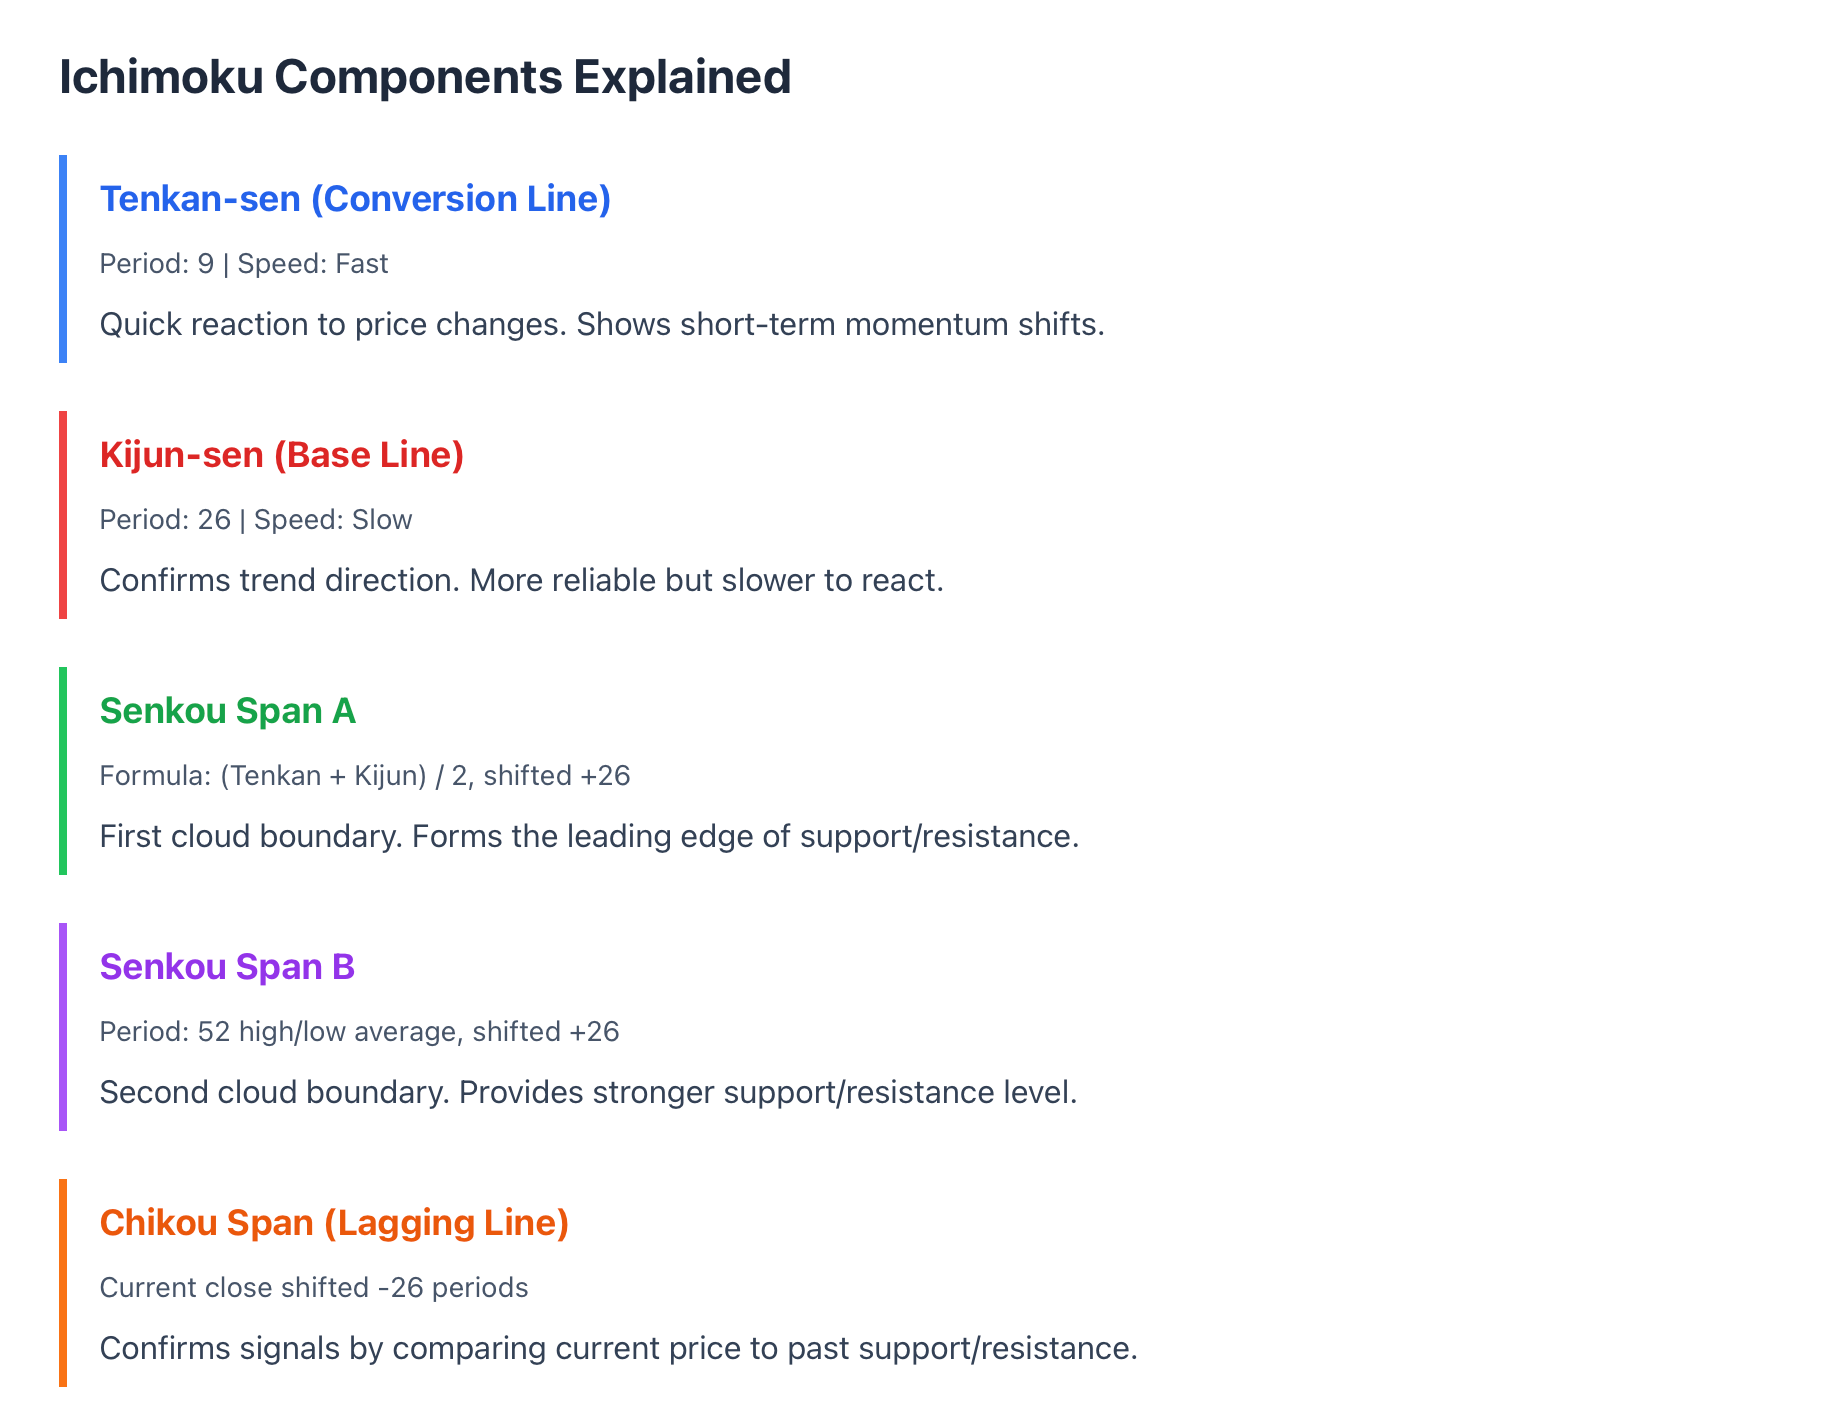
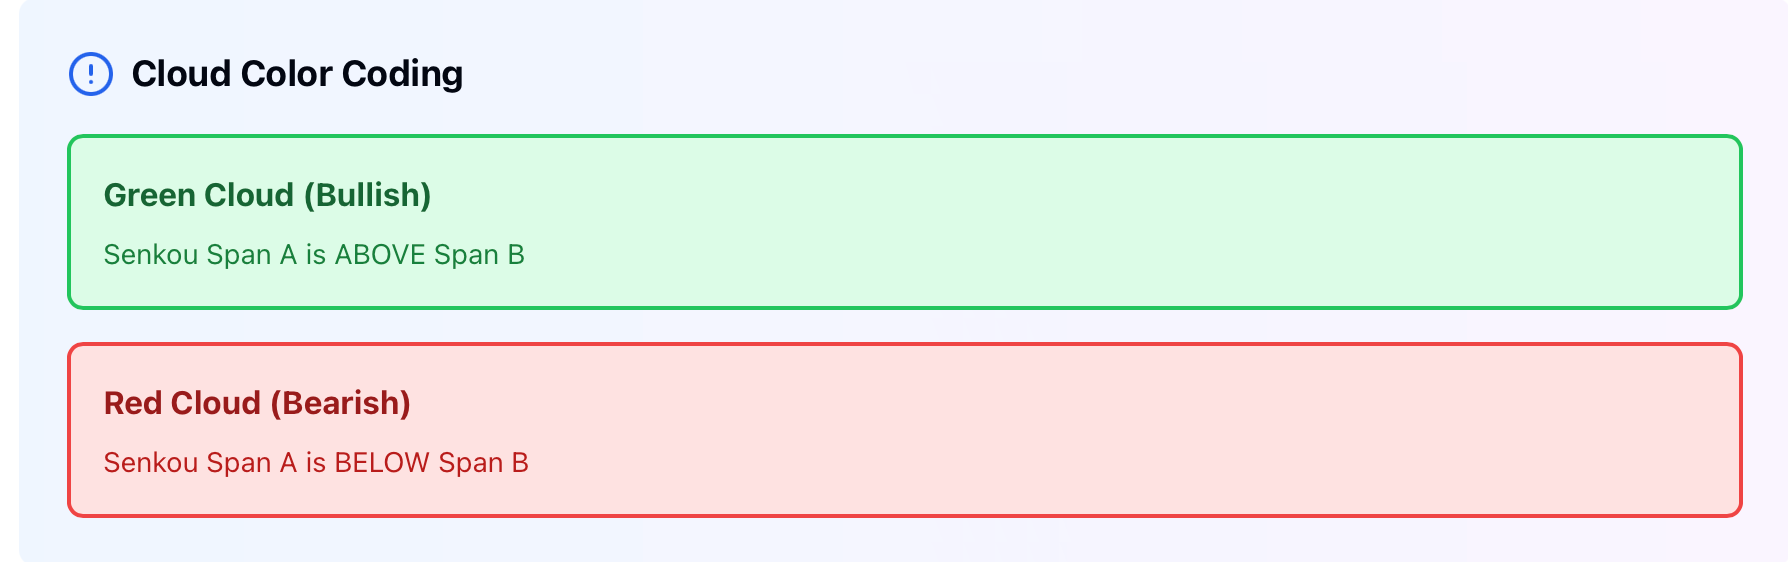
Senkou Span A is simply the midpoint between Tenkan and Kijun plotted 26 periods ahead. Senkou Span B is the average of the highest high and lowest low over the previous 52 periods, also plotted 26 periods ahead. The space between both of these lines produces the cloud. If Span A is above Span B, then the cloud is colored green; if Span A is below Span B, then the cloud is colored red.
Chikou Span is today's closing price plotted 26 periods in the past. It might sound silly, but this lagging line is extremely useful for confirmation of the current price action in relation to past support and resistance.
On a USD/JPY daily chart, you might see Tenkan bouncing off of Kijun, while it still has a nice cushion above a thick green cloud. This would be bullish of course.The thickness of the cloud indicates stout support and the crossover indicates momentum in that direction.
Reading Trends with the Cloud
The cloud's position to price is your first and most important signal.
Price above the cloud: Bullish trend and now the cloud acts as support. If price taps towards the cloud and bounces, that's your confirmation to look for long entries.
Price below the cloud: Bearish trend and the cloud is now resistance. Rallies back to the cloud often got rejected thus providing you with a shorts opportunity.
Price in the cloud: Neutral or consolidating. This is where most traders get chopped up. The market is not firm in direction yet and you want to wait for momentum either way.
The thickness of the cloud means everything too. As I said, a thick cloud means stout support or resistance and a thin cloud can easily be pierced leading to fakes.
Take bitcoin for example during the sideways period in early 2024. When BTC broke above the cloud on the daily and went green and thick clouds appeared, that was your signal. While the trend was clearly bullish , the cloud had provided several support bounces for entry along the way.

Conversely, EUR/USD spent weeks below thick red clouds in mid 2024. Each rally led a rush back down towards the cloud boundary where a classic structure cordoned off and proved simple bearish trend where the cloud had acted as resistance.Changing Support and Resistance
Move past horizontal lines drawn at arbitrary price levels, the cloud provides dynamic support and resistance that moves with the momentum of the market.
The Senkou Spans create these levels. When price approaches the cloud from above, Senkou Span A is first in line as support and then Span B has your back. Price rarely approaches Span B during strong trends. If it does, you are typically looking at a deeper pullback or beginning of a trend change.
The Chikou Span provides additional confirmation. Chikou being above the price cloud from 26 periods ago confirms bullish momentum or below the price cloud for bearish momentum.
GBP/USD was a great example early in 2025. The pair bounced off the top edge of the cloud 3 times before finally breaking out. The bouncing gives you a short opportunity if you kept your stop just above the cloud. The cloud went from resistance to support when it eventually broke.
Think of the cloud like a ball bouncing on a trampoline. The cloud is the trampoline surface. When the ball bounces, that is your opportunity to trade, but once it breaks through the ball is going in the new direction.
-
Catch the buy and sell signals
-
Crossovers are where the fun happens.
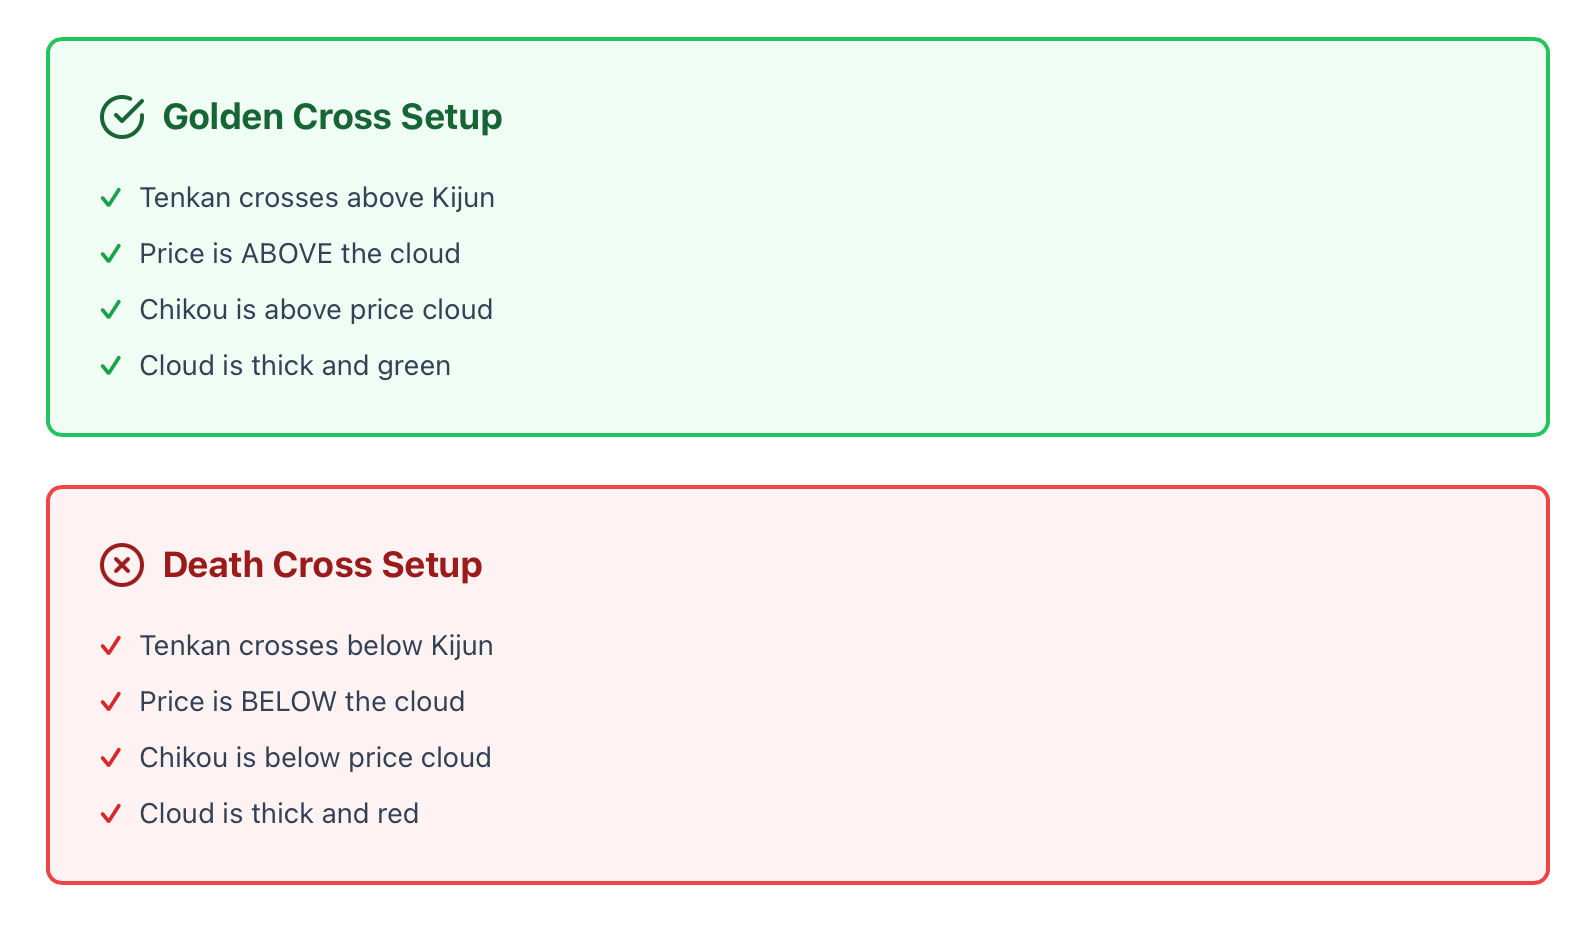
Golden Cross (bullish signal): Tenkan crossing over Kijun while price is above the cloud and what you want to look for is the Chikou Span above the price cloud.
Death Cross (bearish signal): Tenkan crossing under Kijun while the price is below the cloud. Time to start looking for shorts. Again the Chikou needs to be below the price cloud to confirm.
Cloud Breakouts: When price breaks the cloud with significant momentum and you want to make sure it is confirmed with the close above (or below) the cloud and Chikou confirmation the trade might take hold.
In a USD/JPY example: late 2024 when the Tenkan crossed above the Kijun when price was above a thick green cloud at 149.50 and Chikou was above the price cloud and there was your golden cross (that had a follow through over the next month for a 400 pip move). The cloud did its job providing sturdy support each time for the pullbacks.
If you are a crypto trader you know BTC/USD cloud breakouts are legendary. When Bitcoin broke above $40,000 in early 2024 with a cloud breakout and golden cross it just about didn't stop moving to roughly $70,000. The cloud was again solid support when the price launched in a new direction.
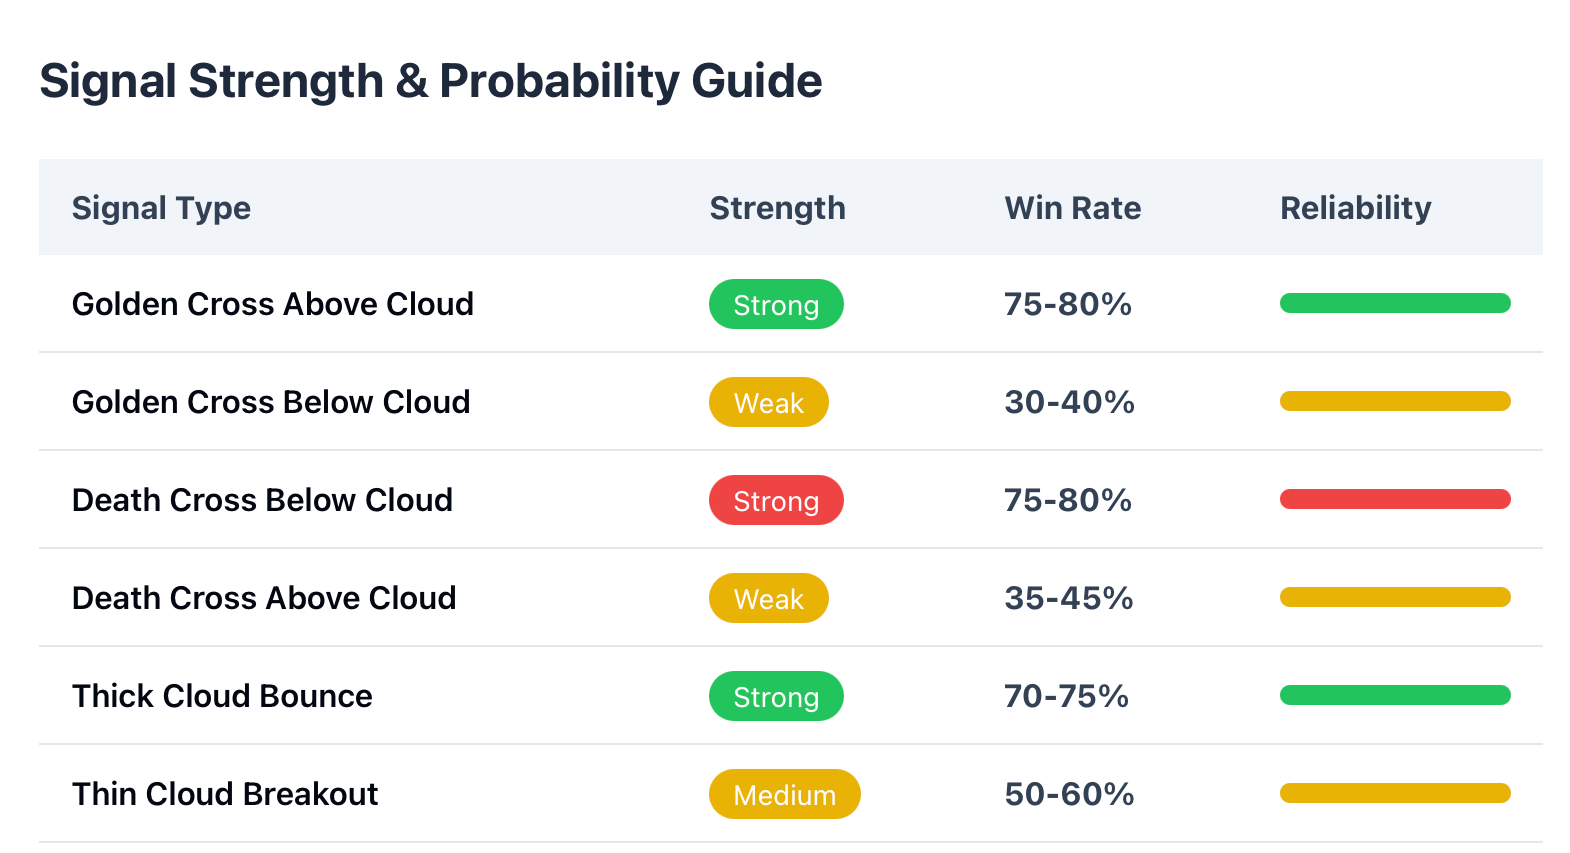
But here’s the kicker: with crossovers you shouldn't just jump on just any crossover to the context of the signal in relation to the trend. A golden cross below the cloud is weak. A death cross above the cloud could just be a pullback. Where the cloud is located when these signals occur is critical to determining if the signal is worth taking.
Advanced Techniques for Better Accuracy
Experienced traders don’t use Ichimoku in a vacuum. They will stack it with other tools, or, in order to filter out noise. Multi-timeframe analysis can be quite useful. Looking at the daily chart will show you the overall trend, and dropping to the 4 hour or 1 hour can be to find the most specific entry. If you see a daily Golden Cross, above the cloud, but the hourly is below its cloud, then you may want to continue to wait for the hourly to confirm.
RSI overlay is useful to avoid buying the currency pair in overbought conditions. If you receive a Golden Cross, but the RSI is also at 70 or above, then price may pullback before continuing its trend, so wait for RSI to below 70 or then see if price retests previous support. MACD confirmation gives you momentum context, for example, if the MACD has "JUST" crossed bullish, and you also have the Ichimoku Golden Cross, then you have a multi-system confirmation structure and it is above average probability set up.
Here is a good example of a trade in January 2025 on GBP/USD. The daily chart confirmed a Golden Cross at 1.2650 and was above the cloud at that price also. At this same time RSI was at 55 (neutral, not overbought allowing a little more room to run) and MACD also crossed bullish at this part of the analysis. All 3 systems of behavior align in common agreement to enter the trade. The pair rallied 200 pips in 1 week's time following that signal.
Now, can you think of the contrast of that trade setup to a false signal the indicator once gave? In this example, the Golden Cross had occurred, yet the RSI was 75, also the extreme overextension (if the MACD had stretched here also, because that is also context). The price consolidated, then reversed within a matter of days.
If you are in a ranging market using Bollinger Bands, overlay that in conjunction with Ichimoku settings to identify ranging behavior. When the price is both inside the cloud, and bouncing between a band, that is a range. Rather than your signal to indicate an entry, wait until the price disengages from the cloud for directional behavior to confirm.
Step-By-Step Trading Process
Let's simplify all of this into a manageable work flow that you can build and replicate on any log you are charting.
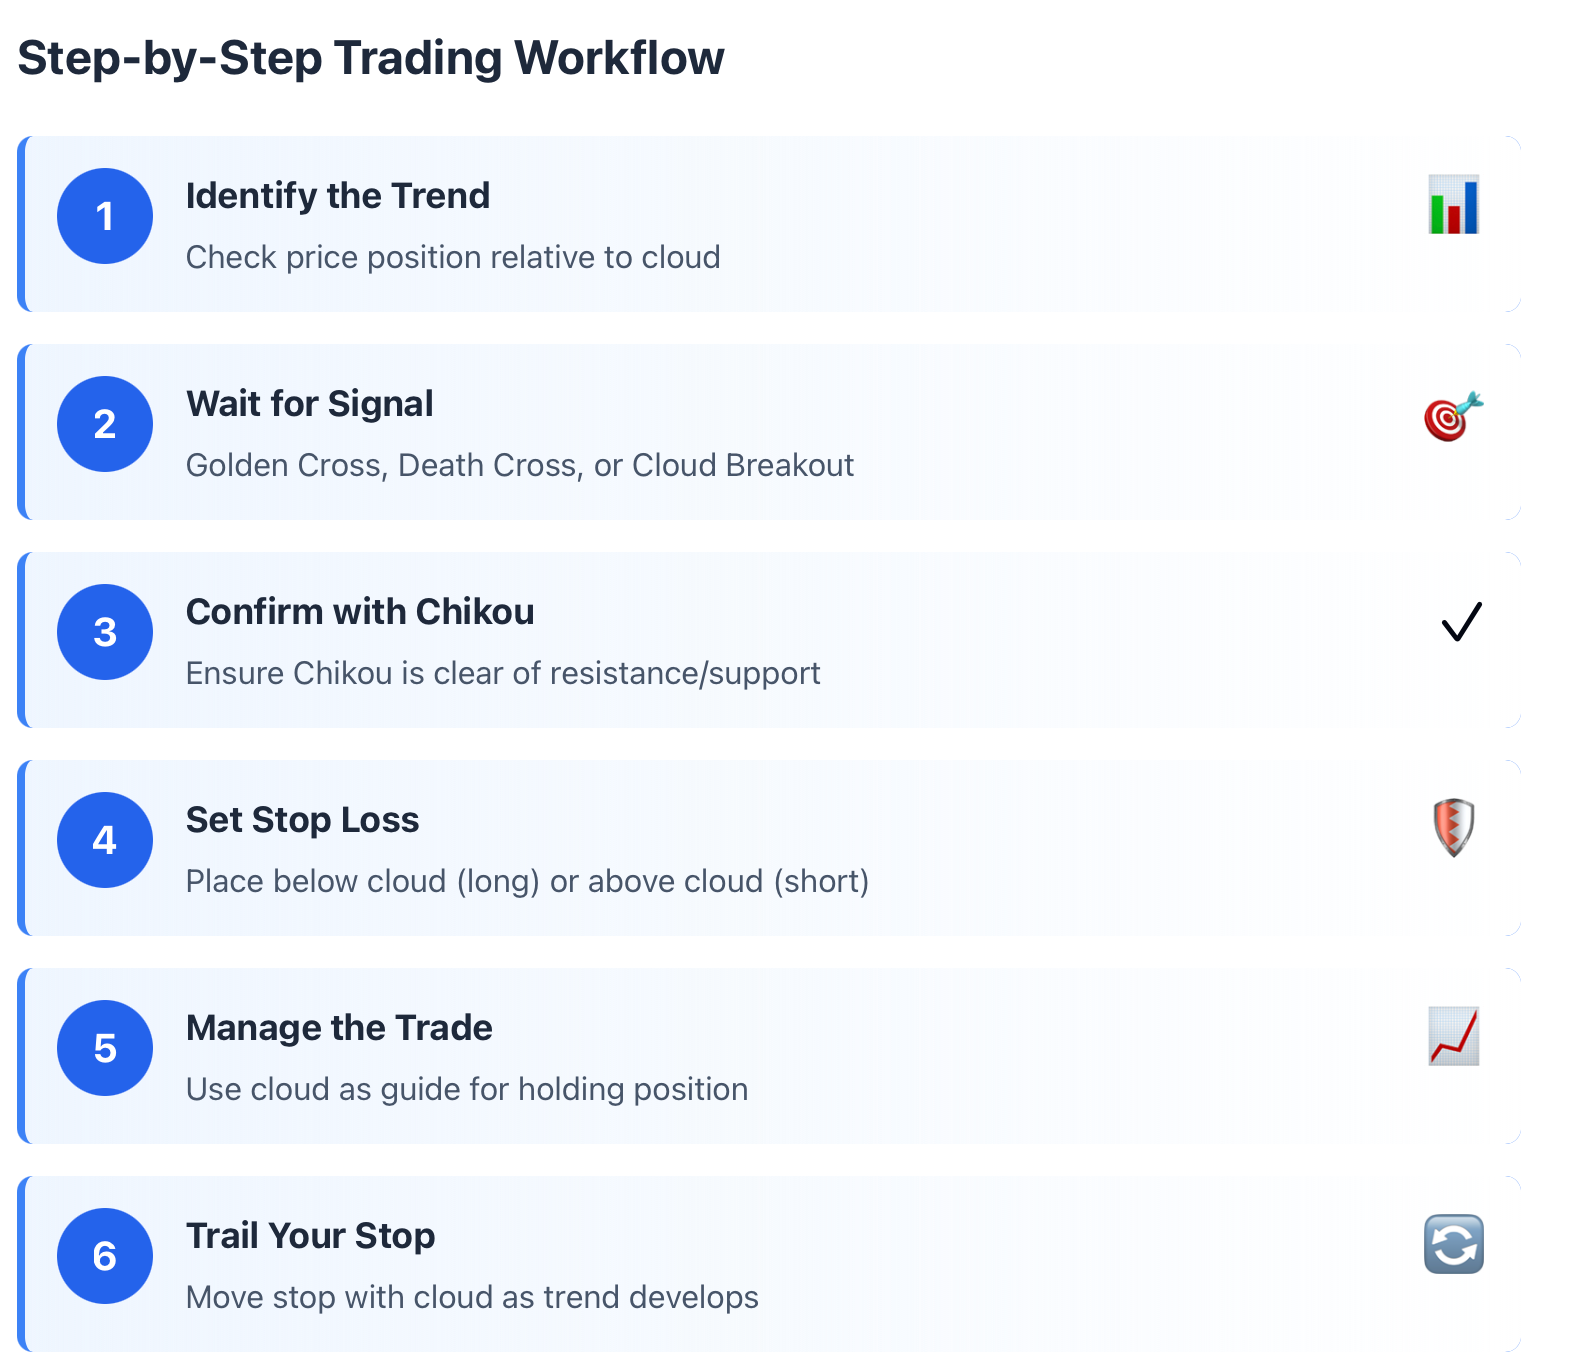
Step one: Identify the trend. Is the price above, below or inside the cloud? If it is above keep your eye out for longs. If it is below, keep your eye out for shorts, if inside wait!
Step two: Wait for a signal. Be that a Golden Cross, Death Cross or Cloud breakout, do NOT trade off a signal unless you can clearly see if. DO NOT FORGET, speed kills.
Step three: Confirm with Chikou Span. You will always be looking to confirm that the Chikou is free of a resistance (for longs), or support (for shorts). If the Chikou Span is covering either resistance and support, your signal is subject to failure.
Step four: Set your stop loss. You will want to place stops just below the cloud for longs, or above the cloud for shorts. If using the cloud is too far away for long term context as a stop loss distance. Set the stop loss at the nearest swing low/high.
Step five: Manage the trade. Use the cloud as a guide for how to be managing trade. If price is staying above the cloud for a long, hold the position, until price breaks into/ below your cloud, then that is the time to reevaluate the stay.
Step six: Trail your stop. As the cloud rises in an uptrend, the stop will be trailing behind it and allow the price to continue to rise without locking in too much. Same with the downtrend, the stop would be trailing behind the cloud.
And here is the example of how this might look as a trade on the Nasdaq 100(H) in late 2024, where the price broke above cloud of 16,200, hard upon the confirmation of the Golden Cross would allow you entry of the trade above 16,250, and from the timeframe, and you would set a stop below the cloud around 15,950 (just below cloud).
Fast forwarding into a scenario while holding the trade where it high as 17,100+ over the course of 3 weeks. And, still able to carry the trade, the cloud stayed bullish and rose with the next week's candle, and the stop was trailing the cloud all along and out concludes where some would lock in 600+.
Then here is another example of BTC/USD a week later where the breakout above the cloud occurred at $42,000, the Chikou Span is also clear. This might allow many traders entry to trade off that break out for $40,500, just below the cloud, and target of around $48,000 in about 2 weeks. Notice, but at this range, I thought the cloud never even got touched, confirming the trend was still strong!
Top Strategies for 2025
Different market conditions follow different approaches. Here are three strategies based on potential conditions in the market.
Trend-Following Strategy: When price is difficult to determine exactly how long above or below the cloud, wait for a pullback back to the cloud and take a trade on the bounce away from the cloud. This is a valid approach during clearly defined strong trends. Examples are the EUR/USD downtrend of 2024 and Bitcoin's trend higher during that same period. Utilize this strategy when the market is strongly trending.
Breakout Strategy: From consolidation in the cloud, wait for some conviction of a breakout until entering. Or take a cross signal if the price closed above the cloud. Historically, BTC/USD breakouts from consolidation in the cloud usually produce the biggest estimated moves that can be expected beyond the break out. Enter this strategy when price is based near the edge of the cloud.
Range-Bound Strategy: If the cloud is flat and the price is oscillating or horizontal relatively nice, trade the range. Buy it at the bottom of the cloud and sell it at the top of the cloud, thereby providing risk management as well if the price breaks prior to the trade. This is the decisively best approach when encountering an overall sideways market like EUR/USD experiences in the low summer volatility months, for example.
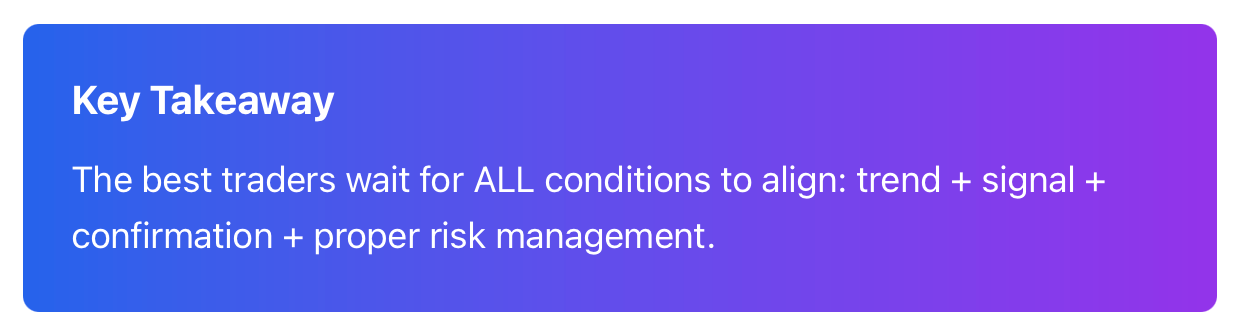
Key to success is being aware of the market condition at all times. For instance, if you try to force a trend-following strategy on a ranging market, you will get stopped several times in a row. Similarly, if you try to trade a strong trend, you will miss the large moves.
Common Mistakes
Even an awesome trading method can have common reasons for trader failure. Here are some of the more common issues traders will experience, including how to eliminate or lessen the tendency to fall prey to them.
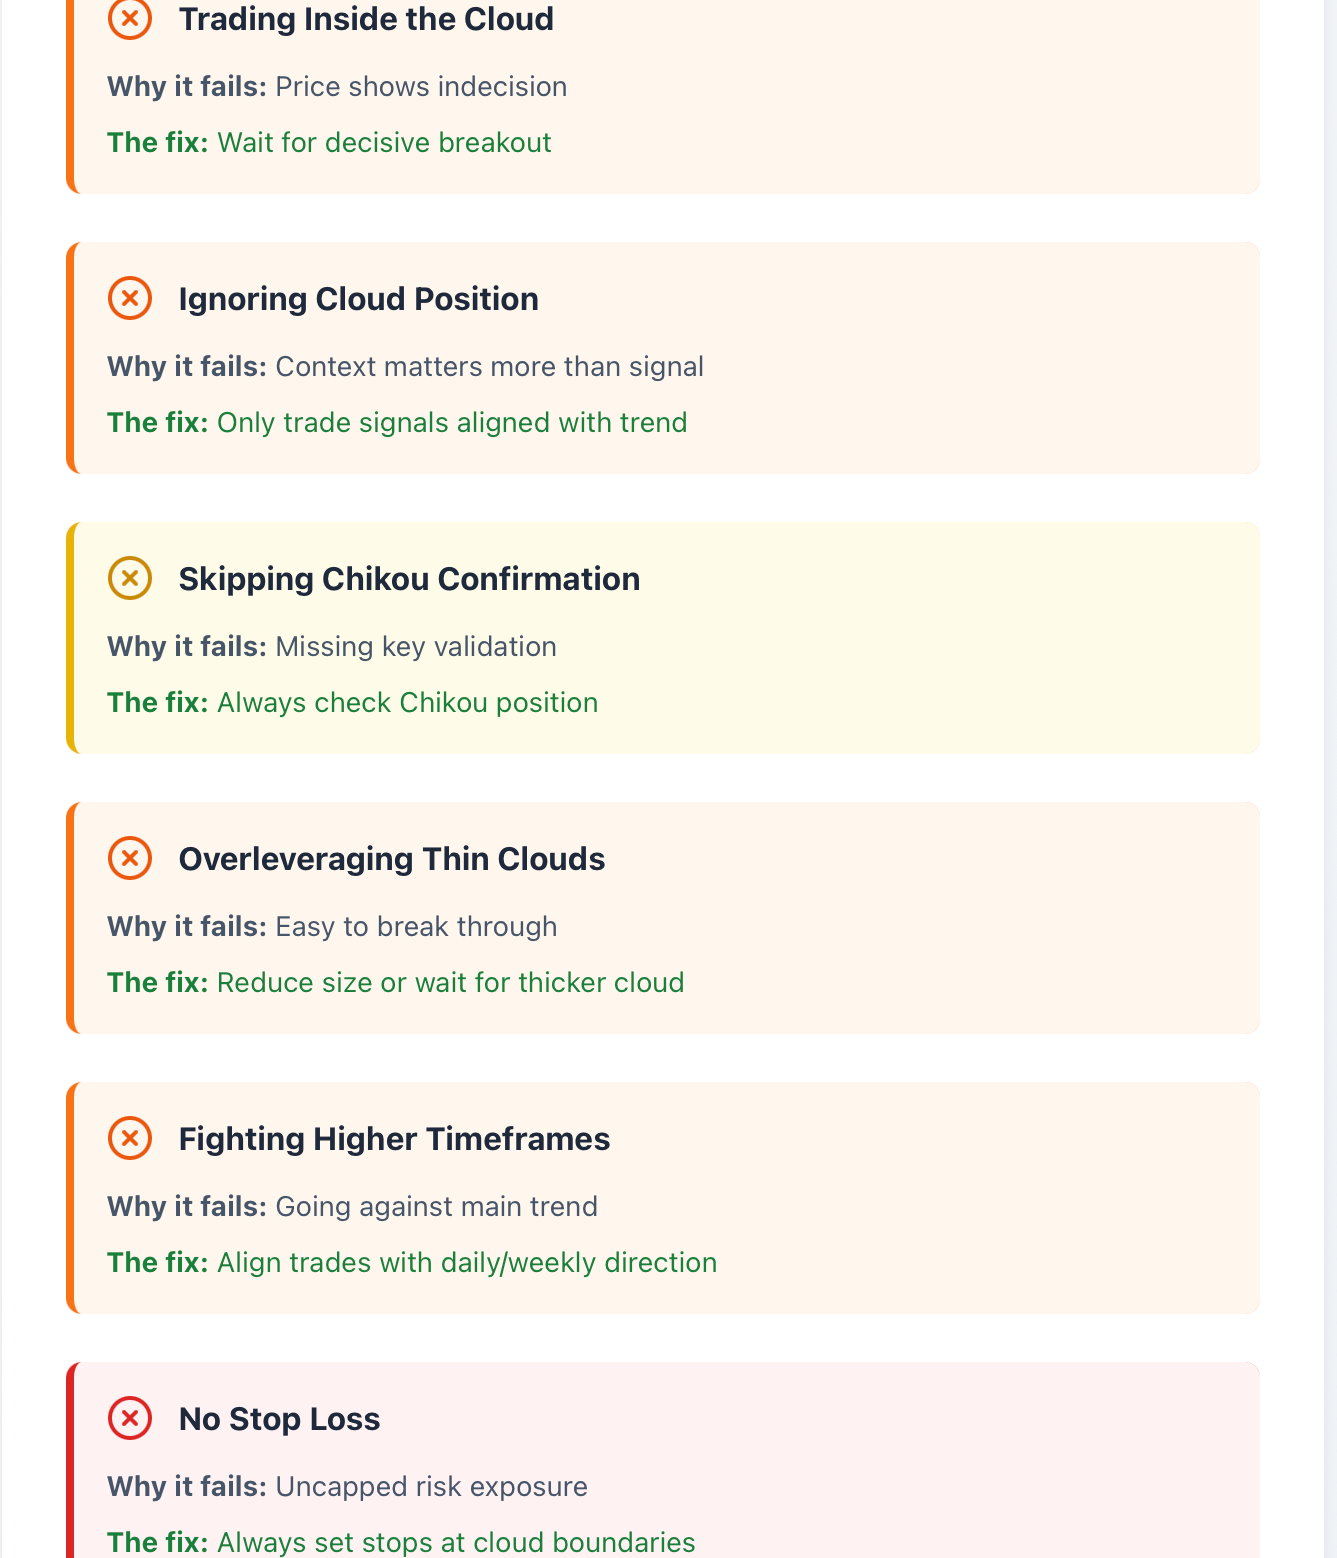
Not considering the cloud position: A Golden Cross signal when the price is below the cloud is honestly an exercise in self-sabotage.The context regarding the trend is more substantial than the crossover.
Trading within the cloud: This is when most traders blow up. Price is showing indecision moving back and forth. Wait for the price to break out decisively before putting money on the table.
Not having confirmation with Chikou Span: Chikou gives you that extra confirmation. If price is tangled up with price action that's over 26 periods old, that signal is weaker.
Overleveraging on thin clouds: A thin cloud is easy to break and price will have fake outs. If the cloud is paper thin, then you need to reduce your position size or wait for it to thicken.
Incorrectly Mixing Timeframes: Trading a 15-minute Golden Cross while the Daily’s chart is under the cloud is fighting the bigger trend. You always want to respect higher timeframes.
Skipping Risk Management: No indicator is perfect. Not using a stop loss is imprudent. While the cloud gives you a logical place to put your stops, be sure to have risk management, period.
EUR/USD showed a great example of multiple false cloud breakouts in mid-2024. Traders who jumped the first breakout without waiting for confirmation get stopped out. Traders who waited for Chikou confirmation and a second test of their level can catch the real move.
Your Next Steps
The Ichimoku Cloud is not magic, but it is one of the most comprehensive trading systems you will find. It tells you what trend is going on, gives you entry and exit signals, and gives you logical places to put stops and targets.
To start, apply it to your charts. Watch what price does when it interacts with the cloud over time. Notice that Golden Crosses consistently, and almost always if the price is simply above the cloud, work. Notice that if the Golden Cross is below the cloud, it rarely works. Notice thicker clouds provide stronger support than thin clouds.
Then layer in your other tools. You can add RSI to avoid overextended or oversold, etc. You can use MACD to confirm momentum. You can check more than one timeframe for ideas to align and trade direction with the bigger picture.
The more you use Ichimoku, the more intuitive it gets. The "one glance" that Hosoda intended starts to truly make sense. You see the set ups quicker and thus trade with more confidence.
Are you ready to see Ichimoku Cloud in action on your instance in your own charts? Open an instance of your trading platform. Now add the indicator to your charts, and identify one clean setup with your immediacy from the rules from this entire guide, paper trade it, record your results, and watch how the price respects the cloud. The best way to learn and implement is through doing.