


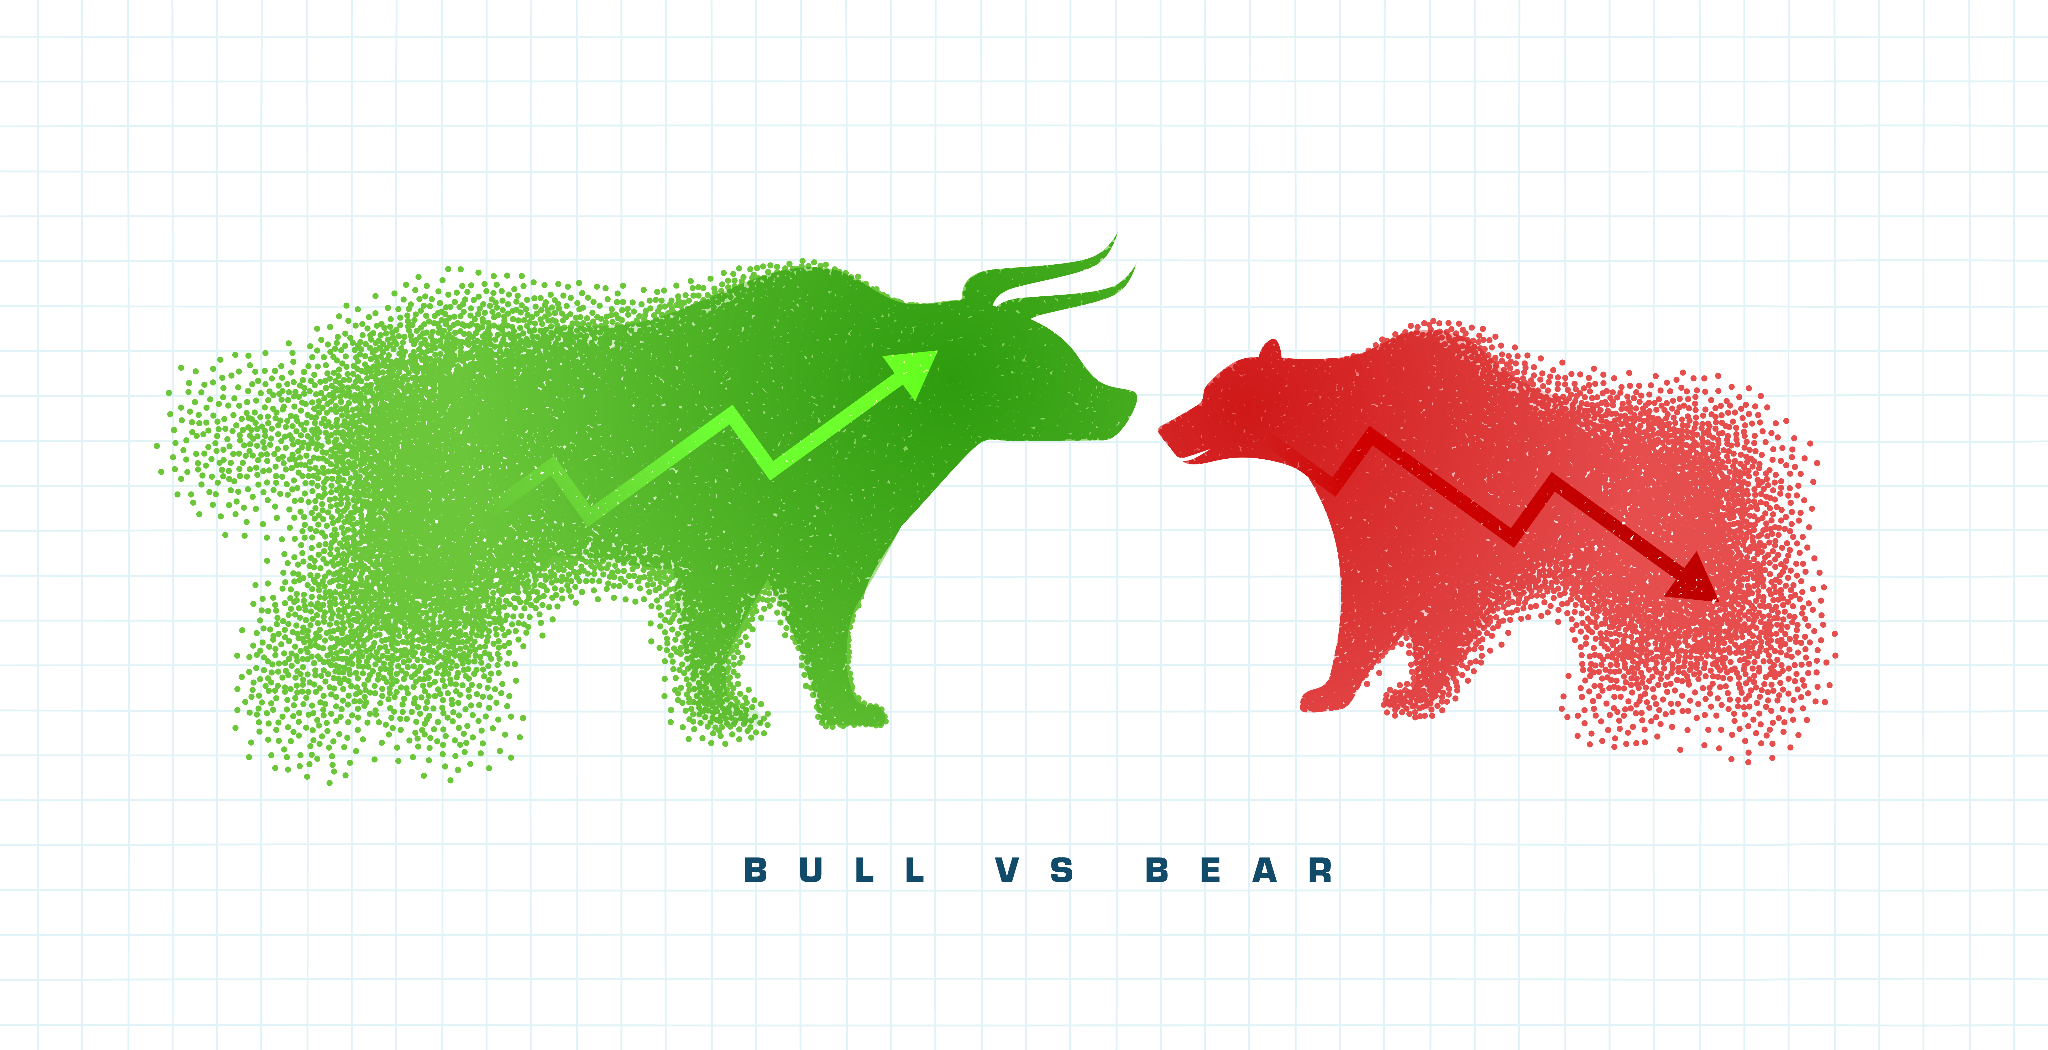
When the markets start to go down, the majority of traders will panic. However, astute traders will look for price patterns that inform them exactly of the next price movement. The most reliable indicator during a downtrend is the bearish flag pattern, a continuation pattern that has allowed thousands of traders to position themselves in front of sizable price drops.
If you've ever watched a stock or cryptocurrency collapse, pause momentarily, then continue lower after, you've witnessed the bearish flag pattern. This is not a reversal pattern or an indication of a bounce to hope for. This is to acknowledge that selling pressure was just taking a slight break on a run to lower prices.
What is a Bearish Flag Pattern?
A Bearish Flag Pattern is a technical chart pattern that forms in a downtrend. Think of it like the market catching its breath, preparing to keep going lower. It is named for its visual formation, which is a large steep decline moving down (the flagpole) and the price moves up very slightly in a flag formation (the flag).
The pattern appears to form midway through a decline. Following a period of aggressive selling, the buyers step in and a short period of price rise (consolidation) occurs afterwards, which may look like a reversal to new or inexperienced traders. However, it is merely a pause. Once the flag breaks and continues down, the downtrend usually continues with increased momentum.
Traders specifically look for the bearish flag pattern, alongside other patterns next, to take a position for a high probability short.The bearish flag pattern has easily identifiable entry points, target levels, and stop-loss levels, which is why it has become a go-to pattern for many technical analysts trading forex, stocks and cryptos.
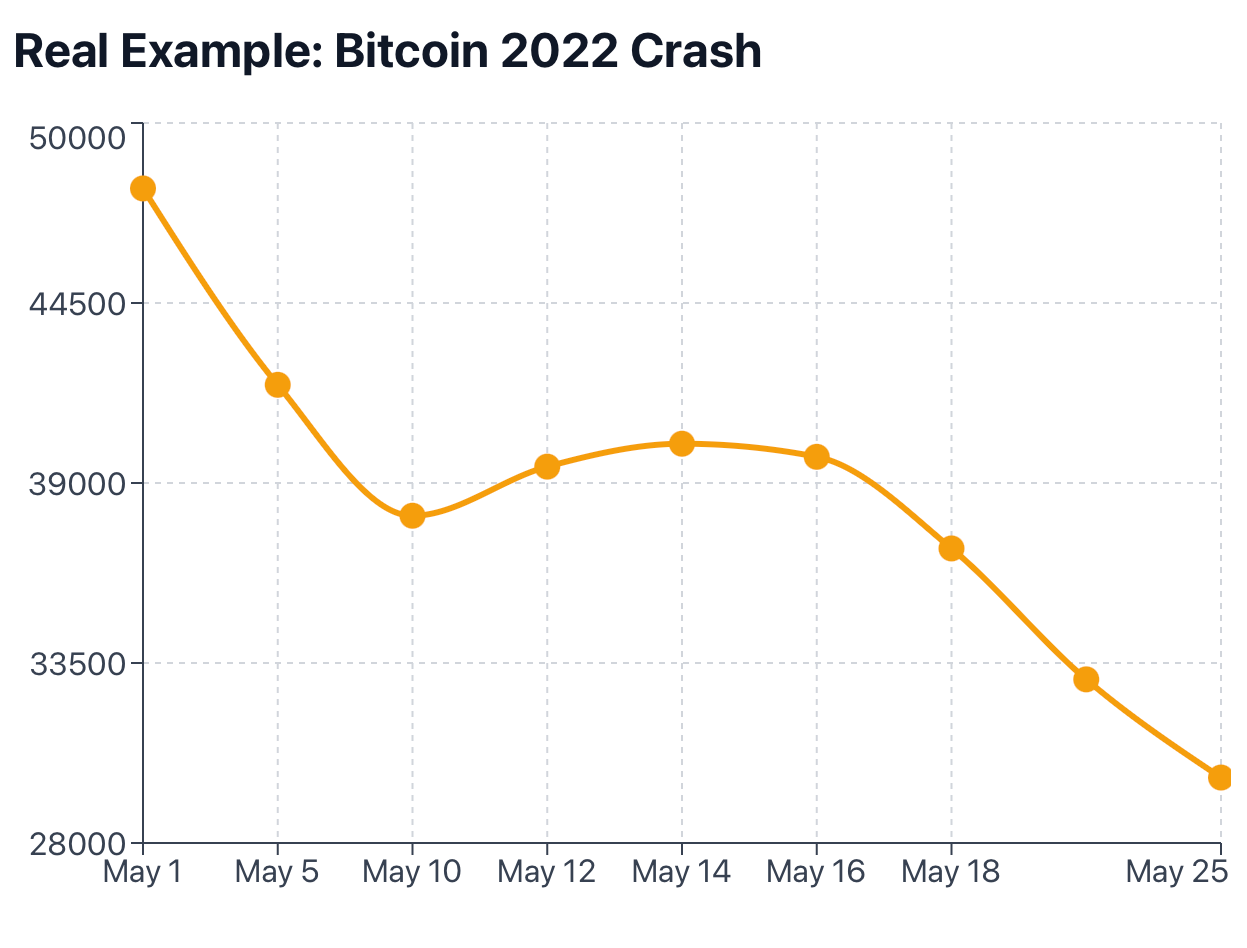
Real Life Example: When Bitcoin crashed from $48,000 to $30,000 in 2022, the market printed a textbook bearish flag. After dropping to roughly $38,000, BTC traded upward in a compressed channel for a couple of days before breaking down and continuing its slide to the low $30,000s. Those traders that recognized the bearish flag pattern could have positioned themselves for the next leg down.
Simple Analogy: Imagine a playground slide. A kid slides down the slide quickly (the flagpole), grabs the railing to slow down for a second (the flag) then lets go as he slides the rest of the way down (the breakout). The bearish flag works exactly the same, an initial sharp drop, a pause for a moment then a continuation down (the breakout).
The key concept to understand is this: a bearish flag in of itself is not a reversal signal. It does not indicate in any way that the market is turning bullish again. The bearish flag implies at some level that selling pressure is still in control and therefore the path of least resistance remains lower.
Anatomy of a Bearish Flag: A Closer Look
Every bearish flag, and all other repeated patterns have three distinct areas, and when you understand the ins and outs of each you will be able to clearly distinguish real opportunity from a fake one.
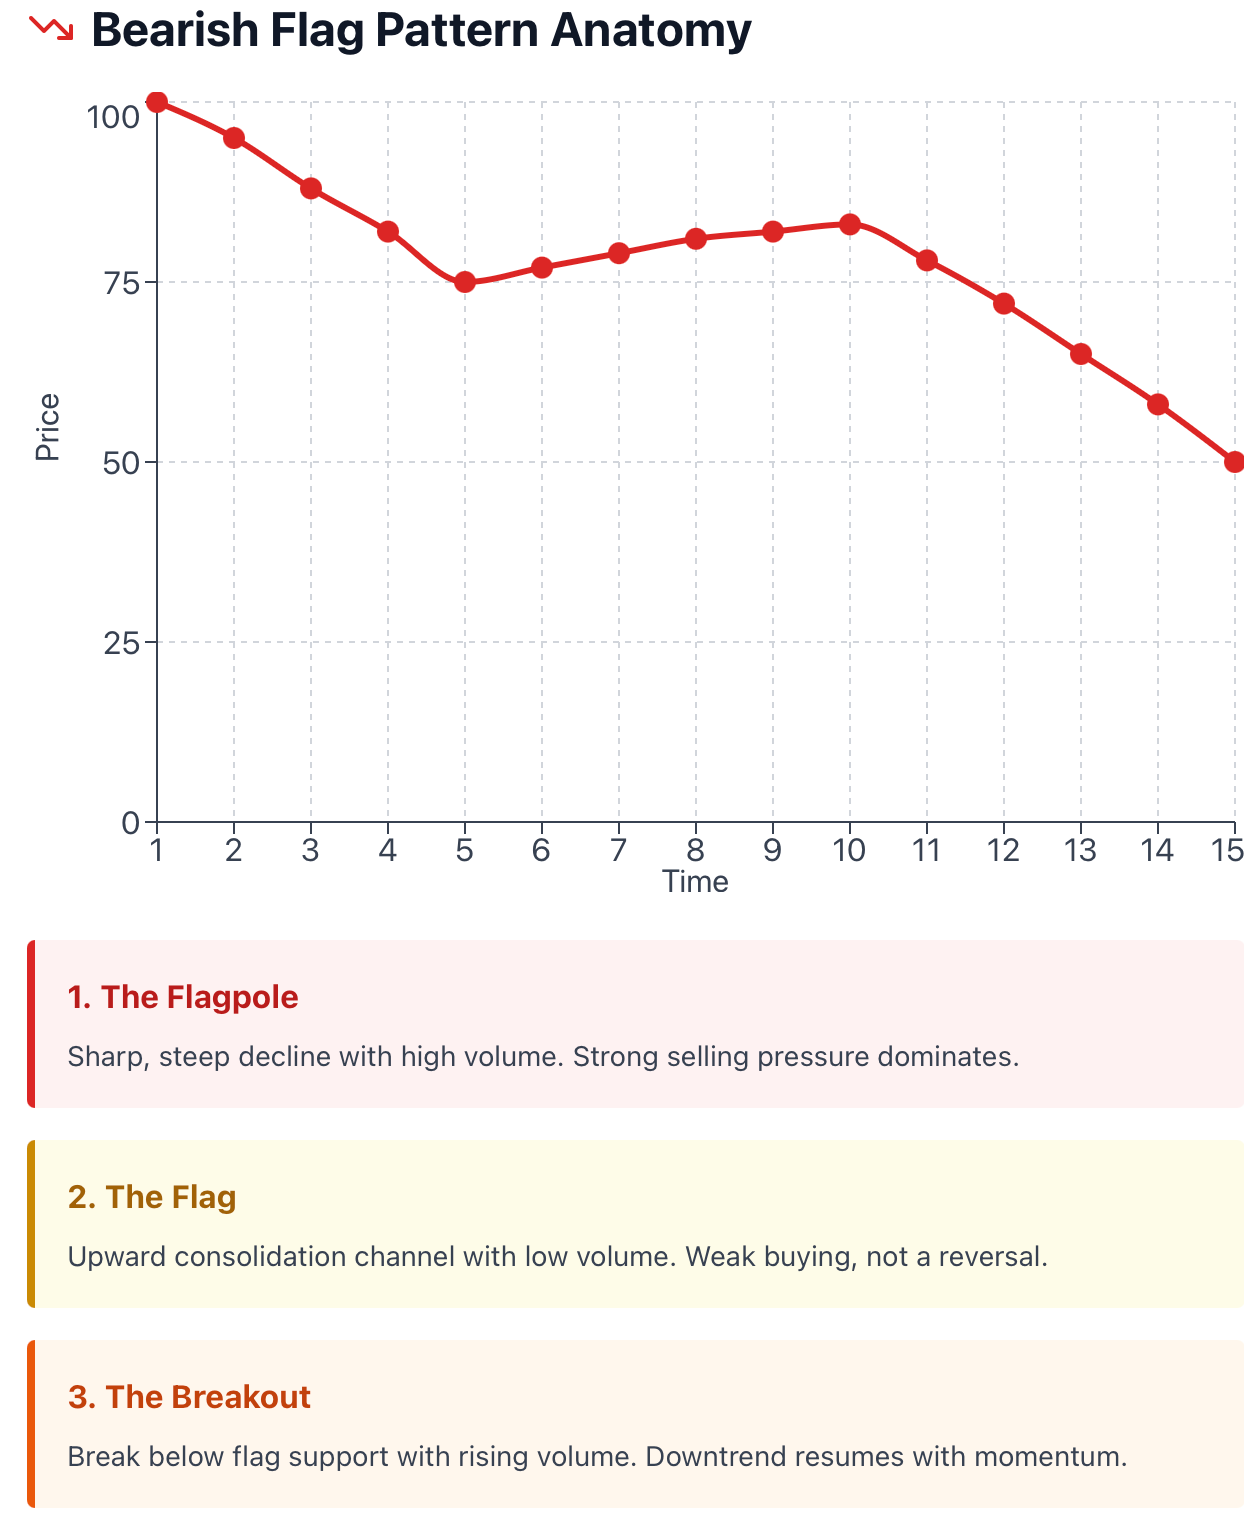
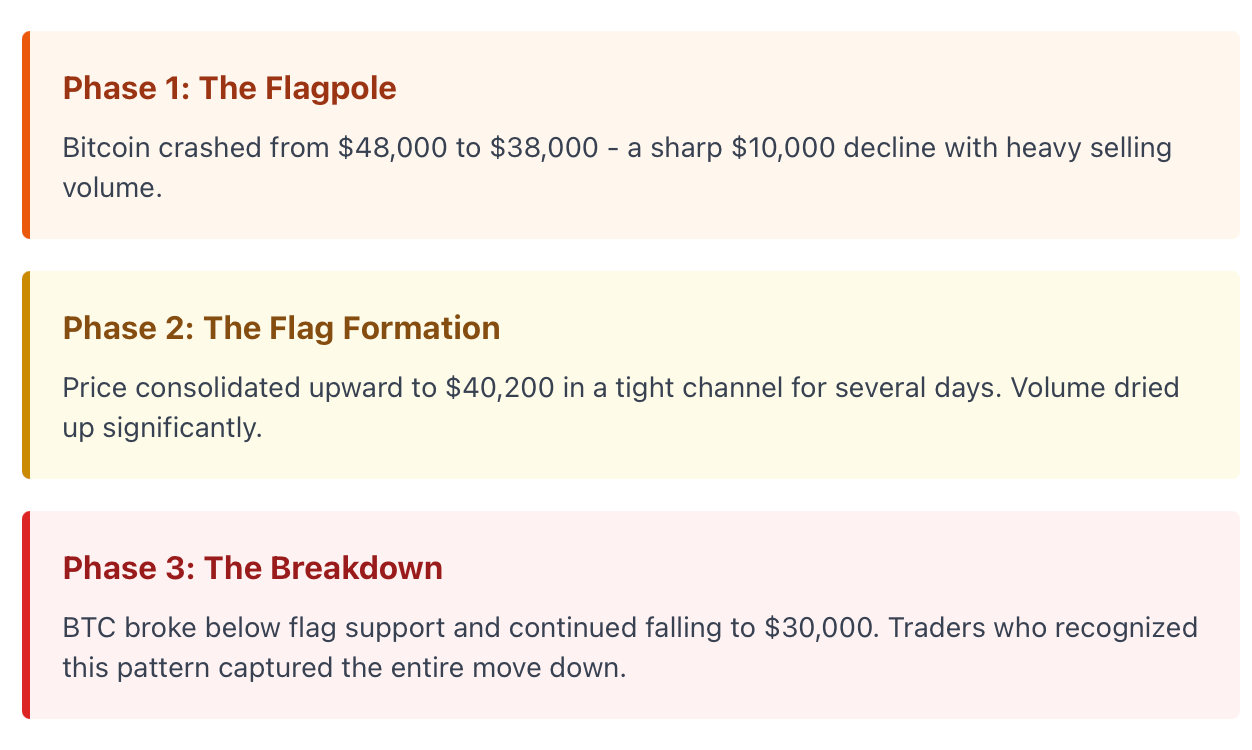
The Flagpole: The flagpole is the initial abrupt price drop that creates the bearish flag pattern. This rapid price decline has come from sellers, it is usually created from some sort of negative news, earnings disappointment, or generalized weakness in the broader market. You will want to see the flagpole be steep and relatively straight, easing downward, indicating that sellers were structurally in control and not fighting for it. Volume in this phase is high as buyers were forced up in the selling frenzy.
The Flag: After aggressive selling, the market goes into consolidation. Prices drift slightly higher or sideways creating a channel that gently slopes upward against the direction of the downtrend. This is only a shallow retracement that will recover roughly 30-50% of the price drop from the flagpole. The limits of the flag should be parallel and create either a rectangular shape or very slightly upward sloping. You will want to see volume drop significantly at this point indicating to you that there is no concentration or conviction in the buying during this phase. The slight upward drift is made from weak buyers or short covering, not actual sustained reversal.
The Breakout: The bearish flag pattern ends and the signal occurs when price moves below the lower support of the flag. Price has broken below and out of the flag, indicating that sellers have resumed control and are ready to continue the original downtrend. At the breakout there should be some increase in volume demonstrating renewed reluctance from sellers, and this is the breakdown that you seek as it represents more selling into the market. This will also become the trigger to position short or add to short positions.
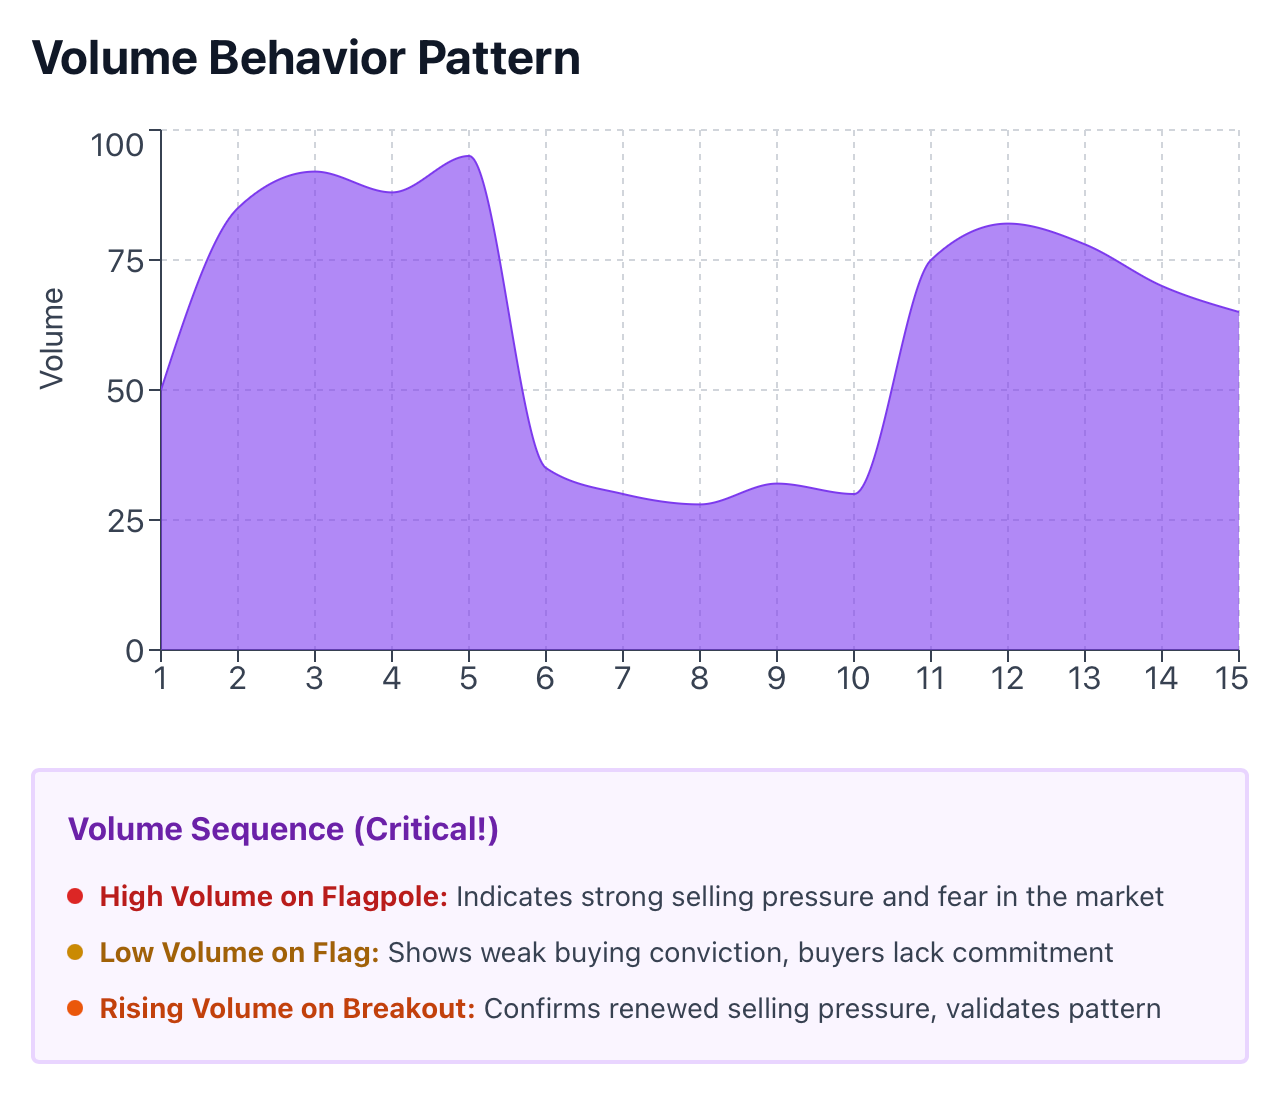
Volume Behavior Matters: Volume is the secret sauce that separates true flags from random consolidations. Use this volume behavior sequence: broad high volume on the flagpole (strong selling), low volume on the flag (weak buying), higher volume at the breakdown (renewed sellers). If volume does not follow the sequence, treat these setups cautiously.
Bearish Flag vs Bearish Pennant: What's the Difference?Both patterns indicate continuation but flags are often deemed to be more reliable since they provide you more thorough time to review the setup and prepare your trade. Pennants develop faster and may be harder to catch.
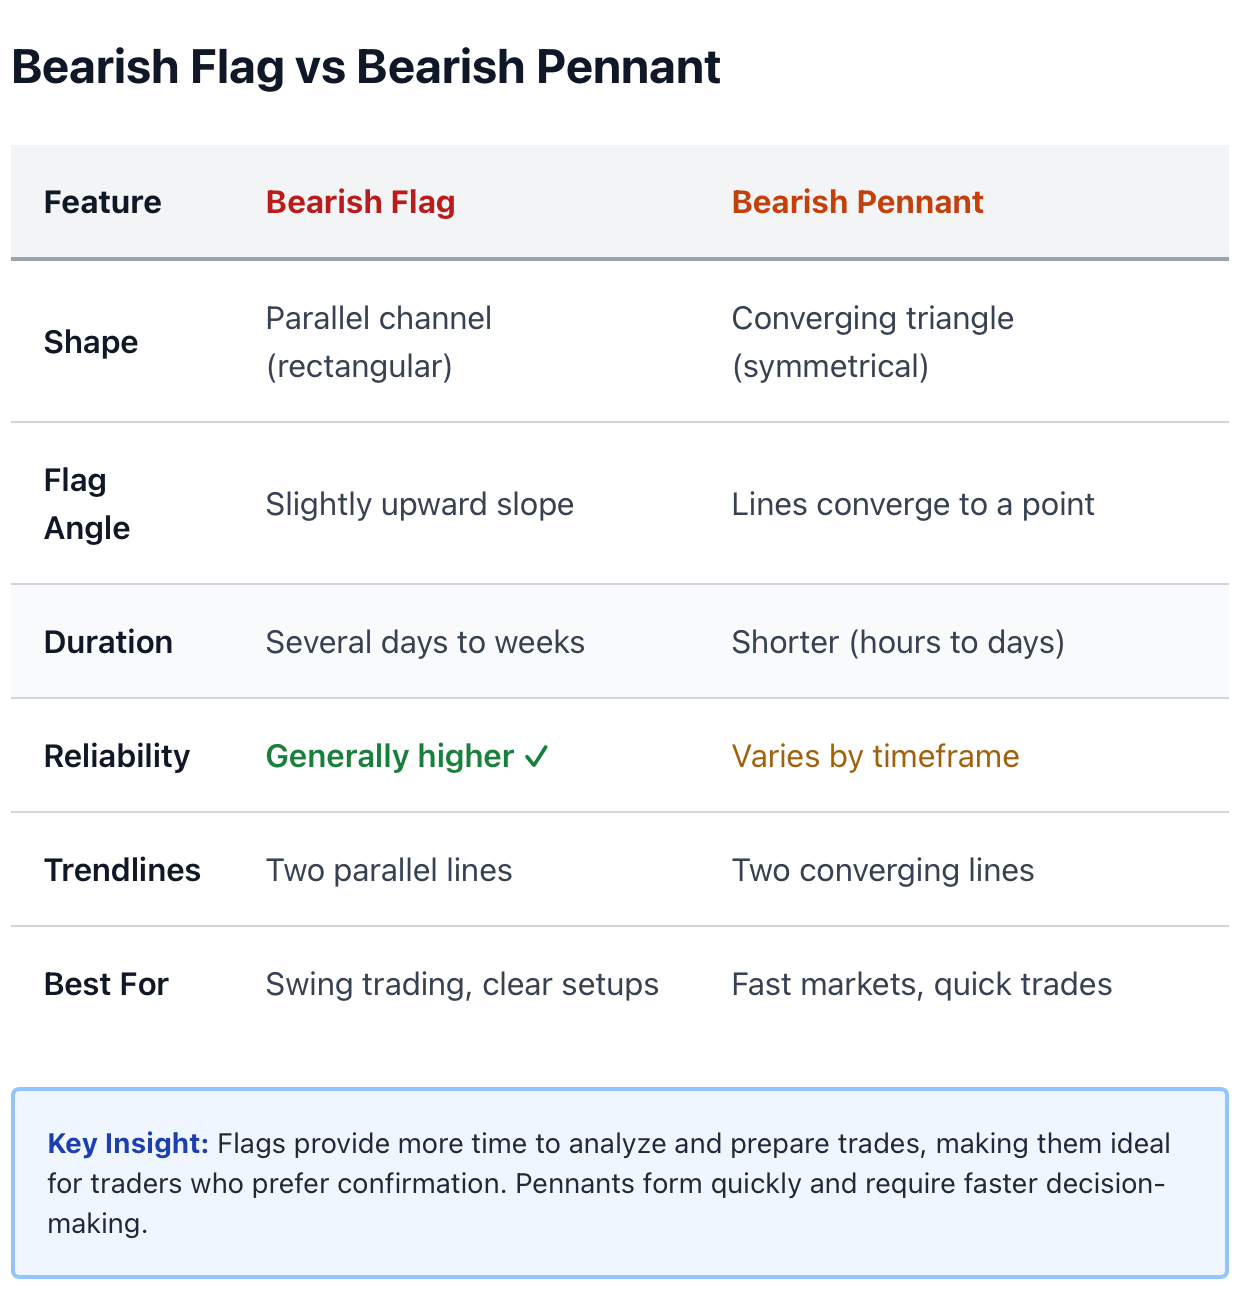
Real-Life Example: The S&P 500 declined in late 2023 and a number of bear flags setups appeared. After each leg down, the index would consolidate for 5-10 days in a tight upward channel before breaking down again. An aware trader could have understood the setup and anticipated each continuation move.
A true bear flag has symmetry, clear trendlines, and clear shift in volume in conjunction. All of these aspects to a bear flag are essential to formulate a high probability setup. Without these characteristics, you might just be looking at a consolidation and not a tradeable pattern.
How to Identify a Bear Flag on Price Charts
Identifying a bear flag in real-time requires a systematic process and here it is step by step.
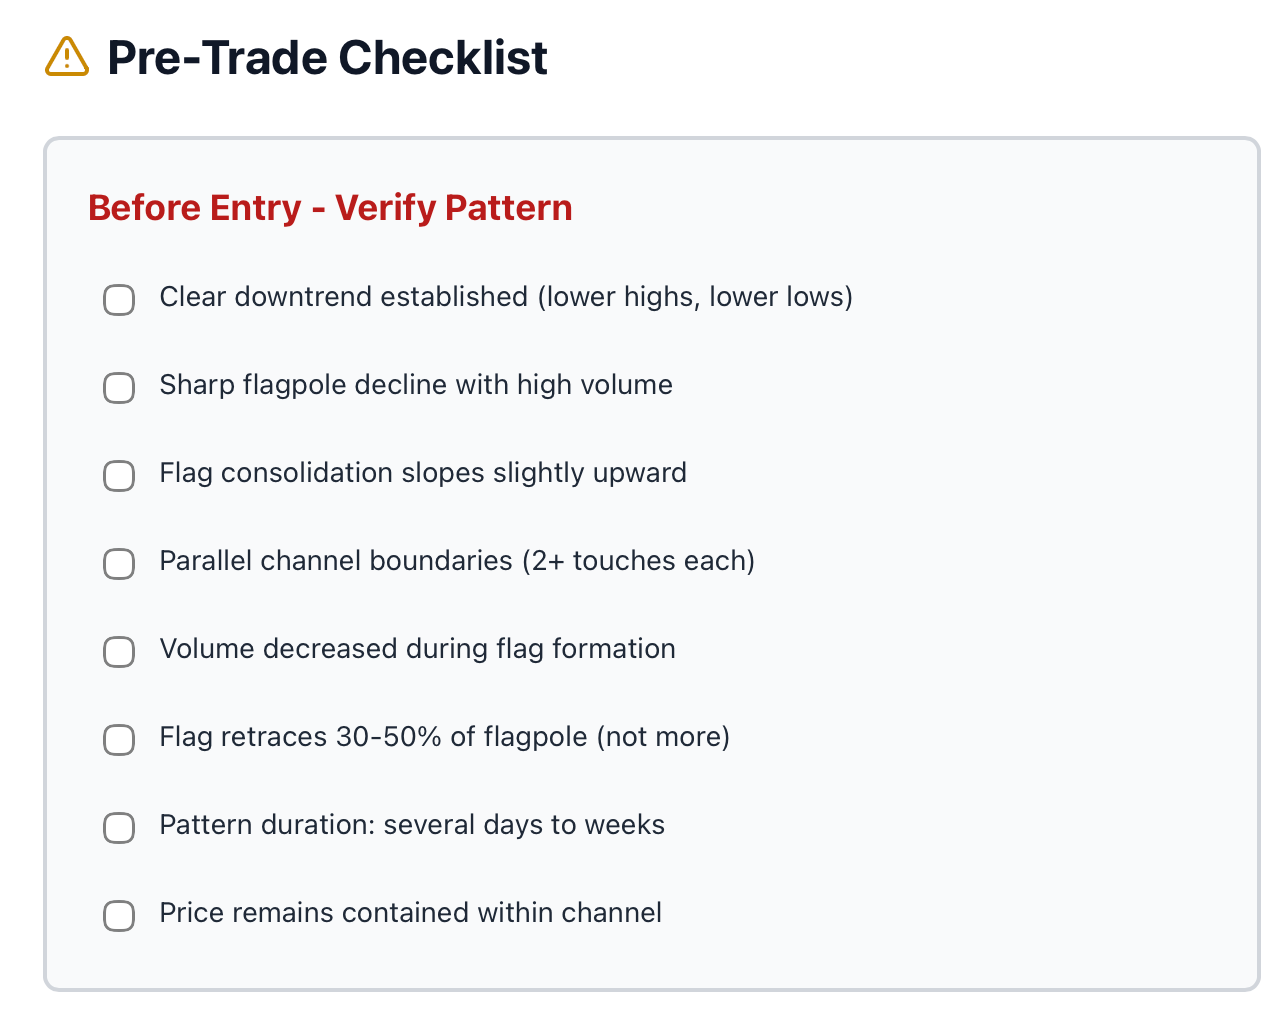
Start with Trend: Bear flags only work in a down trend. If the market is not currently going down, then you are not looking at a bear flag. Look at the larger context: are lower highs and lower lows being made? Is the market traded under key moving averages? Verifying that a down trend exists is your first filter.
Draw Your Trendlines: Once a sharp down move is in place followed by consolidation up, draw trendlines making sure to connect the top high and low (the flag area.)The flag formation should either slope upward or move diagonal upwards somewhat. If the lines merge together at a steep enough angle, you are likely seeing a pennant. You want two or more touches at each trendline for channel confirmation.
Pick the Right Timeframe: Bearish flag patterns work across all timeframes but the daily and 4-hour timeframes have the strongest overall results. The shorter timeframes produce more noise and false breakouts. The longer timeframes have a longer timeframe to develop, but are approaching a more reliable trade. For swing trades use daily charts, for intraday trades 4-hour charts are ideal.
Look for these core signs:
-
The upward retracement is shallow, ideally less than half of the flagpole decline.
-
Volume noticeably declines with consolidation above in the flag pattern.
-
Flags last typically a few days or a few weeks. Less than that indicates a pennant and longer could mean a different formation is developing.
-
Price remains contained in the channel area.
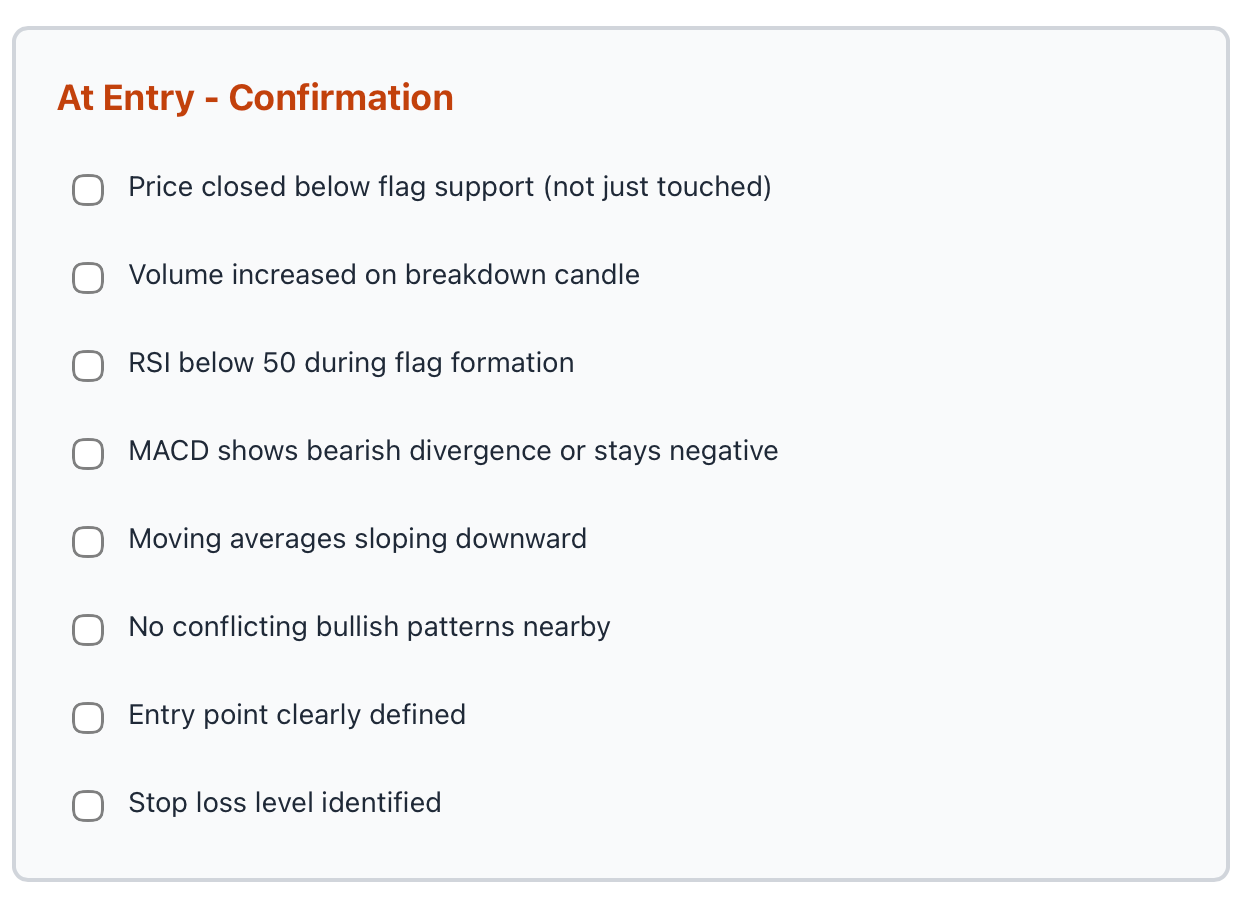
Use Confirmation Tools: Don't just rely on price action, add technical indicators to your analysis. The Relative Strength Index (RSI) should be below 50 while the flag pattern warning of weakness is still developing below the surface. The MACD signal line should stay negative or appear to show a bearish divergence. The moving averages, if used (like 20-day and 50-day MAs) should slope down with price below the moving average line.
Real Life Example: In 2024 when Nvidia corrected had a clear bearish flag on the daily chart after descending on price dropping from $140 to $120 for about 2 weeks at $130 and consolidated in a slight upward channel before breaking down. Those traders waiting for the breakdown confirmation timely price action would have had the opportunity to enter the trade short, and understand their risk parameters.
The cardinal rule is to wait for the breakdown confirmation before you enter. The breakout confirmation is the close below the flag support line with increased volume, it is not when the price moves below. You should never anticipate the break downward. The market can drift for a longer time frame than what you think. Those that anticipate the break downward are typically removed out of the trade.
How to Trade the Bearish Flag Pattern
Recognizing the pattern is one thing. Participating in it profitably requires executing the strategy correctly and managing risk in a disciplined manner.
Entry Point: Enter the short position when price has broken and closed below the lower support line of the flag pattern. Remember the importance of a close. Price will sometimes drop below support intraday and then return above it before the close of the candle, causing a false breakout. Waiting for the close precludes these fakeouts from entering into your trades. For added confirmation of the breakdown, check for volume increasing on the breakdown candle.
Stop Loss Placement: Your stop loss should be placed slightly above the upper boundary of the flag. This makes sense as if price returns into or above the flag it has failed. It is also a good idea to put a small buffer (maybe 1-2% above the upper line) to account for a whipsaw that may happen, yet offer your capital protection. The goal is to keep your stop tight enough to protect your capital, but wide enough to account for normal volatility.
Take Profit Target: The measuring technique is very straightforward. You simply measure the height of the flagpole by measuring from the start of the decline, to the lowest point before the market starts consolidating. You then project that same distance down from the breakout point. This will give you your minimum price target. Here is the logic: markets will always continue the move that started them in a move, to proportionality, to their initial thrust. For example if the flagpole dropped 10 points, and the breakout occurred at 50, your target would be at 40 (50-10).Many traders will take partial profits at this measured target and let the rest run with a trailing stop.
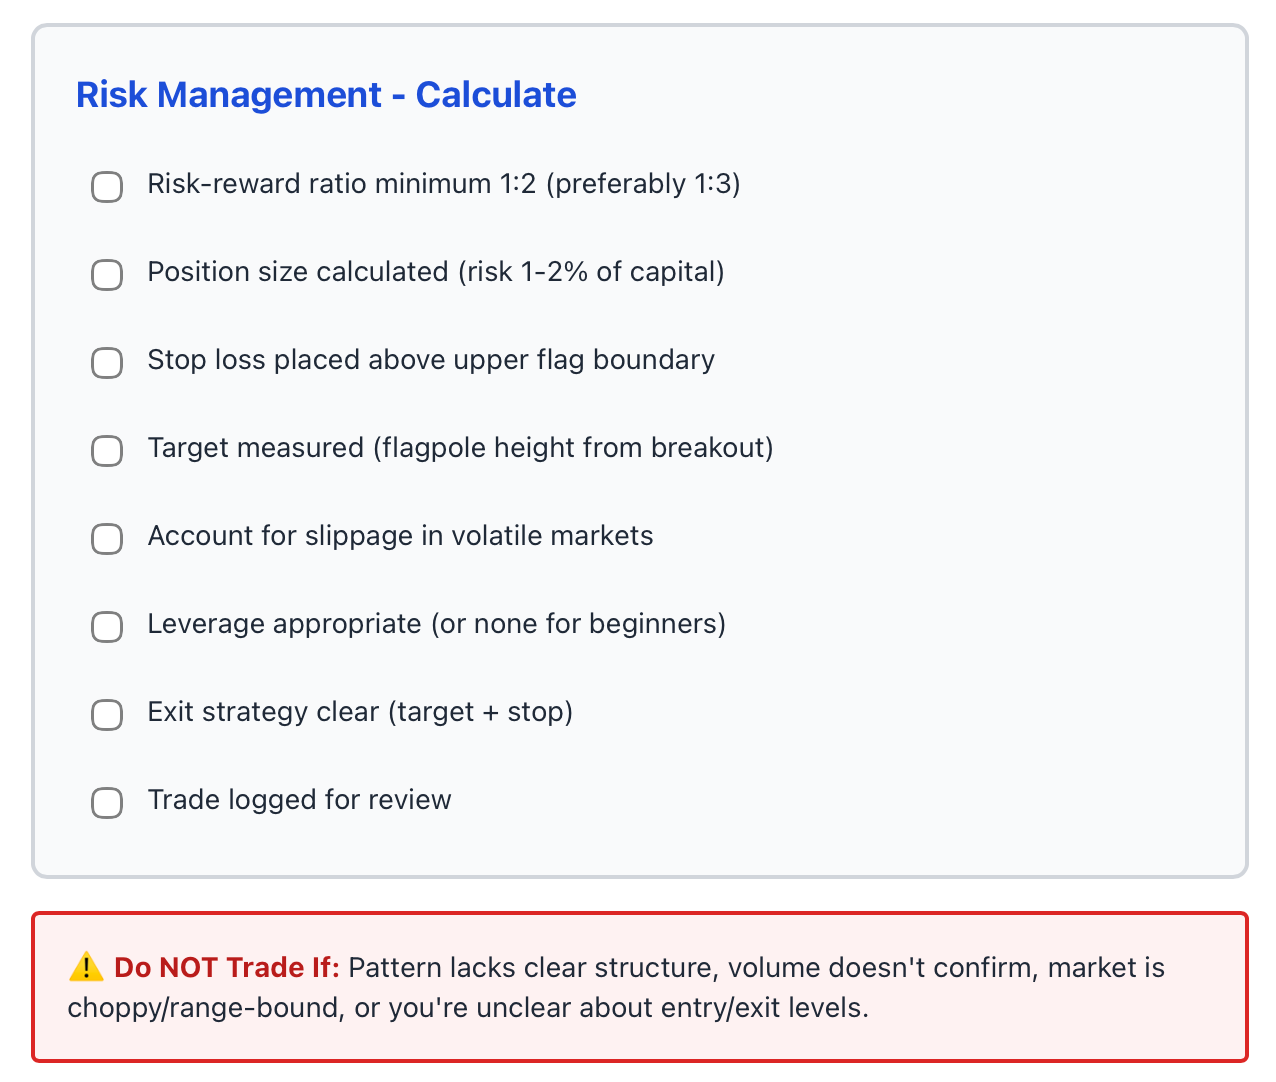
Risk-Reward Ratio: Before entering, always calculate your risk-reward. You should aim for at least 1:2 risk-reward, meaning your potential profit should be at least twice your potential loss.
Bearish flags often offer a 1:3 risk-reward or better because the flagpole offers a large potential move while the tight flag structure keeps the stop relatively close.
Using the example from above: If you entered at 50, with your stop at 53 (3 points of risk) and targeting 40 (10 points of gain), you would enjoy a 1:3.33 risk-reward ratio. That is the kind of set-up worth taking.
Position Sizing: You should never risk more than 1-2% of your trading capital on any single trade, regardless of how perfect the set-up seems. Position size is based on stop distance. If your account is $10,000 and you want to risk 1% ($100) with a stop 2 points away, you could buy 50 units or shares.
Leverage Awareness: If you are trading CFDs of forex or using margin, please remember that leverage amplifies gains and losses. A bearish flag could give you an 8% move, but using 10x leverage that’s 80% gain on your capital if you are right. If you are wrong, 80% loss. Most traders should avoid using higher leverage until they can prove consistency in profit at lower risk.
Real Example: The EUR/USD offered a bearish flag set-up in mid-2023 after moving lower from 1.1200 to 1.0900. The pair then consolidated upward to 1.1000 over 10 days before it broke down again. A trader that entered at 1.0890 (just below the flag) and placed their stop at 1.1020 (above the flag) could set a target at 1.0590 (based on the 300 pip flagpole). That would give a risk of 130 pips for a reward of 300 pips, a risk-reward of approximately 1:2.3.
Managing the Trade: Once you are in the trade, don’t micromanage. Let the trade play out as expected. If the price reaches your target, take profits. If the price reaches your stop, take the loss and move on. The absolute worst decision would be to move your stop further away because you got "involved" because of "believing" the set-up would work. As traders, take it as a fact that all patterns do fail eventually, hence the need for risk management.
Consider partially taking profits at the measured target level and moving the stop of the remainder to breakeven. This way, you lock in profit but allow the trade the possibility to exceed your expectations if selling pressure continues.
I strongly believe that even if you have the perfect chart pattern, it will still fail without sound risk control in place. The bearish flag provides a set-situation with defined risk and reward, but it is discipline that separates technical analysis from the reality of profit. There is an art to mastering the set-up and the pattern of the flag but managing the risk is just as equally important.
Common Mistakes Traders Make with Bearish Flags
Even seasoned traders can fall victim to these pitfalls when trading bearish flag patterns.
Confusing Sideways Ranges with Valid Flags: Not every period of consolidation following a move lower is a bearish flag. In order for the "flag" portion to be valid, the flag needs to have a slight upward tilt with well-defined channel boundaries. Movements sideways in a random fashion with no meaningful structure cannot be traded as flags. If you cannot combine the highs and lows along clean parallel lines, it is probably worthless as a tradable flag.
Failure to Consider Volume: Volume is not optional; it is an essential component of the pattern. If the volume stays flat during the consolidation or there is no increase in volume when the stock breaks out, the pattern should be regarded as having been broken. High volume during the flag indicates some real buyers were present and now have new positions, which means this entire pattern, valid or invalid, contradicts the premise of the pattern. Always check volume patterns before putting on capital.
Shorting too early: This is the most costly mistake. A trader watches the flag develop, and as soon as there is a flag, the trader short the stock, expecting the stock to break down the next day. Flags can consolidate for weeks. During that time, stocks have the potential to grind along higher in the flag before it actually breaks lower and hits your stop.
Surely, the trader also bought back in and may have missed the stock break entirely. Wait for a break below support; a good trader knows that patience will save you more money than guessing or predicting.
Applying Bearish Flags in Choppy Markets: Bearish flags require and work best with visible trends. If the market is choppy and range-bound, low-choppy markets decrease receptiveness to flags by bearing low success rates on frozen price movements. Since the premise is based around certain trends continuing on the breadth of flags in continuance, lack of a strong market or trend equals a weakened signal. This is where you can look at the big picture and not trade until bears exist or flags exist in continuation.
Stops too tight: Yes, tight stops protect capital, but too tight of stops are easily hit from regular volatility. If you place a trader's stop at the top edge of the "flag" without factored margins or edges, you may lose on price gyration instead of the original stock premise. It is important to sometimes build in buffer zones around flags to act as the "market noise" in each range.
Chasing once the stock breaks down: Sometimes the stock price moves so fast to the down side that the trader thinks a price violation is missed. Once the stock starts the move, allowing you to think the moves are being missed, the trades will potentially begin even lower than the price volatility breakout point, and now you're just buying the stock right near an initial failure probe, and one that will no doubt ruin the risk-reward ratio of the security. This increased probability of being a reason buyers are stupidly buying into potential fading with no adequate stop, as if they were chasing. If you missed the prior opportunity, just take the retest at the broken stock level or new high of the shorts.
Real example: "In the case of Tesla," the intraday price action for TSLA had faulty and false bearish flags preceding a collective stock price decline in the late 2021 and 2023. In all instances it appeared that the stock was forming a flag structure upon each measured price decline, meaning price volumes and price patterns did not align, and then price cut back upward instead of downward.
Disregarding trading flag patterns relative to potential volume or pivots would lead to either price scores establishing losses on buying; or convincing yourself that you should trade short on stock without strong backing. All that aside, TSLA executed against some flag patterns weeks later, and successfully on bullish trends.
Real-World Examples: Bearish Flags Across Markets
The beauty of the bearish flag pattern is its universality. It appears in every liquid market where supply and demand determine prices.
Forex Markets: EUR/USD is famous for clean technical patterns. In 2023's downtrend, the pair dropped from 1.1200 to 1.0900, consolidated upward to 1.1000 in a textbook flag, and then broke down to 1.0600. The entire process took about six weeks. The forex markets tend to offer the cleanest flag setups, because currency pairs tend to persist through trends more so than individual stocks.
The flag structure enabled forex traders to have a clear approach: spot the pattern in the consolidation phase, wait for the breakdown, go short with a defined risk, and then target the measured move. The flag pattern performed exactly as planned.
Stock Markets: Meta Platforms (Formerly Facebook) printed multiple bearish flags during the selloff in the year of 2022. After an initial decline from $220 to $190, a retracement occurred for two weeks, before breaking down to $160. The second flag and resumed decline once again to $140. Each of the flags provided a way for traders positioned on the short side to enter.
Obviously, Netflix printed similar rejection pattern signs and exhibited similar patterns when its subscribers withdrew. In much the same way, there were sharp declines and a retracement followed by consolidation, which enabled multiple tradable instances for the trader whose eyes stayed glued on the patterns. The tech stocks, although higher volatility, exhibit extreme trends relative to the price movement so they can be the cause for the extreme bearish flags in terms of price action.
Cryptocurrency Markets: Bitcoin and Ether are a pattern traders dream. The bear market of 2022 seemed like a bearish flag after a bearish flag, from Bitcoin's viewpoint of the price chart, it dropped down from $48,000, which included three at least bearish flags before bottoming out at approximately $16,000. Each consecutive flag offered the opportunity to short, leading up to its eventual demise. Cryptocurrency markets are incredibly unstable and move very quickly which means these flags form in shorter timeframes than other markets. A flag that lasts two weeks in stocks can last just three days in crypto. The basics of the structure is the same: sharp drop, short consolidation, follow-on new price lower.
Commodities: Crude oil (WTI) will have bearish flags during times of excess supply or demand concerns. When oil fell from $120 to nearly $70 (in 2023), several flags were formed on the way down. All pullbacks developed false hope of a bottom only for price to make a new low.
The pattern works for many different asset classes exactly because it captures human psychology. After a sharp adjustment lower in price, some traders will take profits and close out short positions, while others are simply trying to find the bottom. The group behavior causes the push or shorted drift up in price. But if the underlying selling pressure has not changed, the relief will not hold. That is what bearish flags show - the drift up as nothing changes below.
These examples are illustrative of the idea. The bearish flag is not some type of magic in one specific market. The reality is that markets have a direction, or rather they yield in waves with impulse and consolidation. Once you see the underlying basic structure in any market, you will see it in any freely traded product.
The Bearish Flag and 2026 Markets
The bearish flag gives traders something that doesn't often take place in technical analysis - a structured and repeatable setup that has a low and high tick, and defined entry and exit signals.You know where to get in, where to get out if you're wrong and where to take profits if you're right.
But here's what distinguishes traders who are profitable, to those that simply recognize patterns: discipline in your execution. Simply finding a bearish flag is not enough. You need to wait for the confirmation, accurately size your position, put your stops down without second-guessing yourself, and take the trade off without greed. The pattern sets the opportunity; however, it's your discipline that will determine if you can capitalize on that opportunity.
The ability to technically analyze a chart is only half of the battle, the other half is the ability to understand the psychology behind that technical chart. A bearish flag is established because the market has paused. Sellers take their profits; bargain hunters jump in, and for a very short period (note, it is short!) the supply and demand finds a sort of balance. Then reality kicks in. If the underlying fundamentals continue to be bearish, someone will take their profit, and then selling pressure resumes down and down markets go.
In 2026 markets, in a world of heightened volatility, and trends can be vicious, the continuation patterns like the bearish flag will take on even more value to you since the aim is to follow, not fight established trends. It keeps you on the correct side of momentum.
Traders who can master this use this pattern to not predict where markets will go, but they see what the market is actually doing. They know when a bearish momentum is simply running out of steam, and they position themselves appropriately in the market. That is not luck. That is reading what the market is communicating.
Once you start to recognize flags in historical charts without risking any money, it is a good idea to also begin to study the flags that worked and the flags that failed. Look for subtle anomalies in the volume patterns, structure, etc. Build your pattern recognition by repetition, not by hope. Yes, I said hope.
So are you ready to act on what you've learned? Open a demo account with BTCDan and trade! Identify bearish flags in live markets where there is NO risk to you. Once you feel comfortable, upgrade to a real trading account with all the tools and charts you need to capitalize on the next major downtrend.