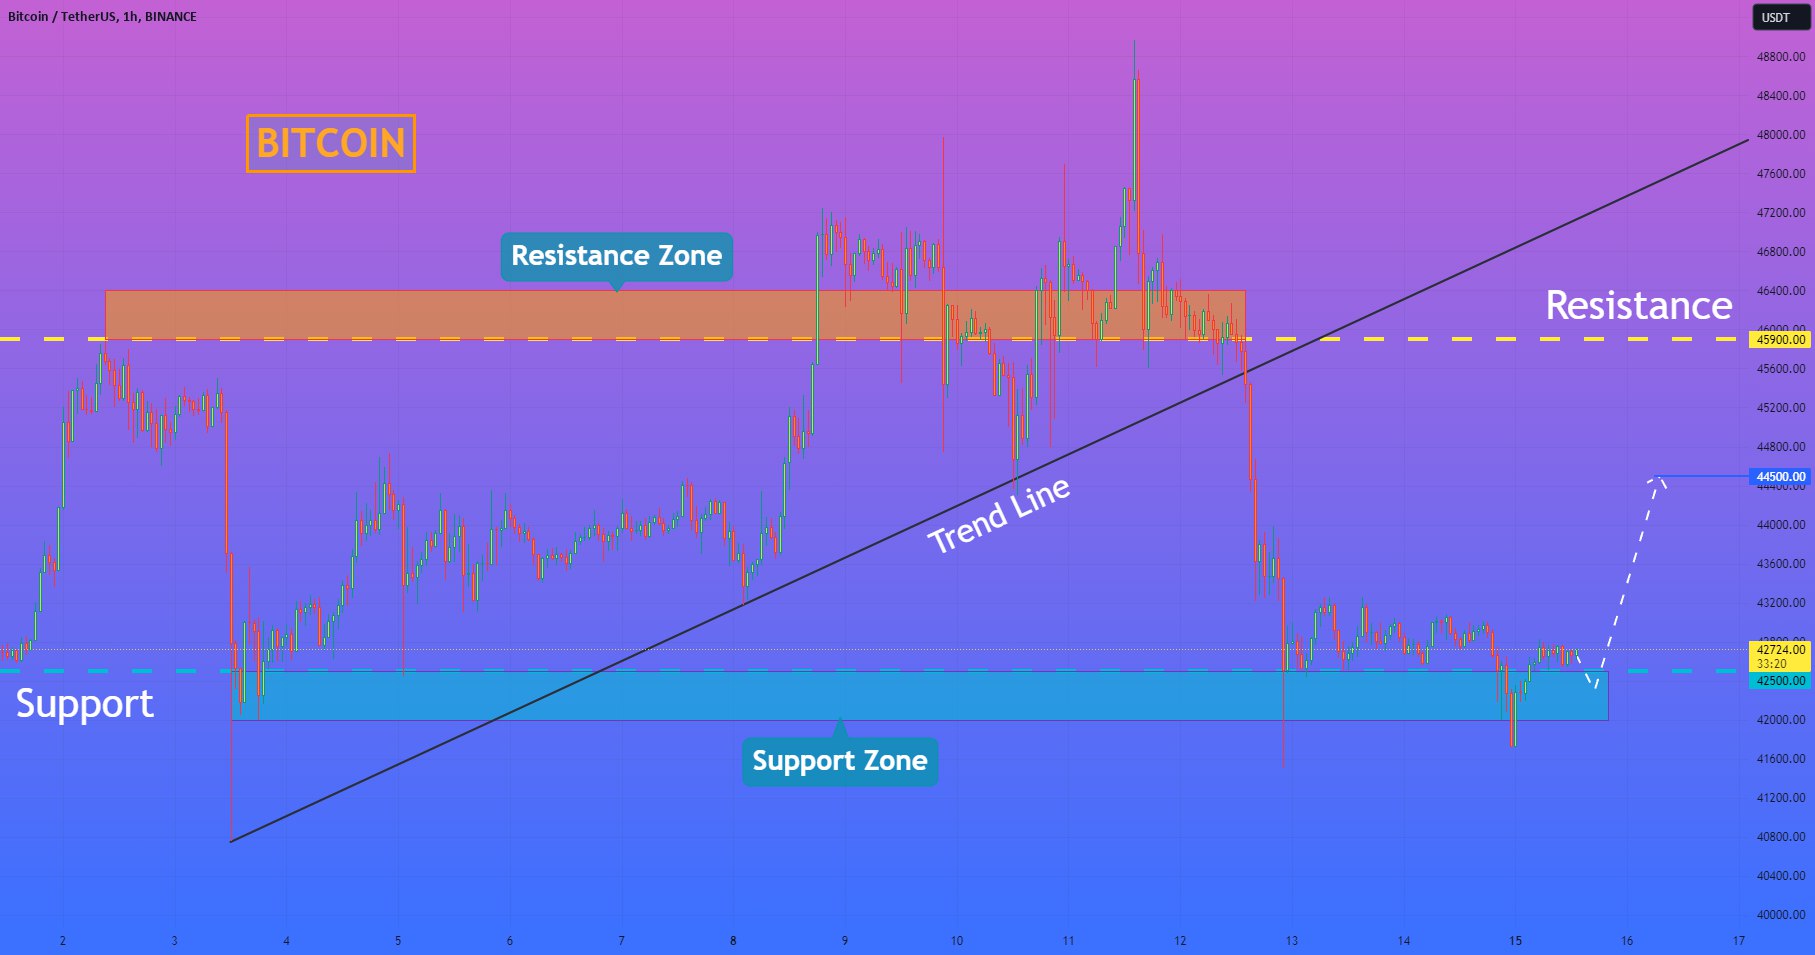
If we look at the chart, we can see how the price a not long time ago rebounded from the 42500 support level and made a strong impulse up to the 45900 resistance level, which coincided with the resistance zone. But soon, BTC rebounded and in a short time declined until to trend line, breaking the support level. Price at once rebounded from the trend line and made impulse back, breaking the 42500 support level again. Next, the price continued to rise and later reached a resistance level and even rose higher, thereby breaking the 45900 level. But soon, Bitcoin turned around and made a strong impulse down to the support level, breaking the 45900 level one more time and the trend line too. BTC first declined to support zone, but later bounced from it and started to trades near the 42500 level. Now it continues to trades near and I expect that Bitcoin can decline to the support zone again and then turn around and start to rise, therefore I set up my target at the 44500 level.
📊QUICK FUNDAMENTAL LOOK
The ratio between longs and shorts for bitcoin on Binance Futures has risen to a multi-month high. This metric is considered a barometer of investor anticipation, with a high long-short ratio indicating that more investors have a positive expectation for the bitcoin price.
⚠️Warning: Trading contains elements of risk, please be careful when Making Orders, Market Recommendations are only for consideration.


