


 📊TECHNICAL ANALYSIS - 4 HOURS TIMEFRAME
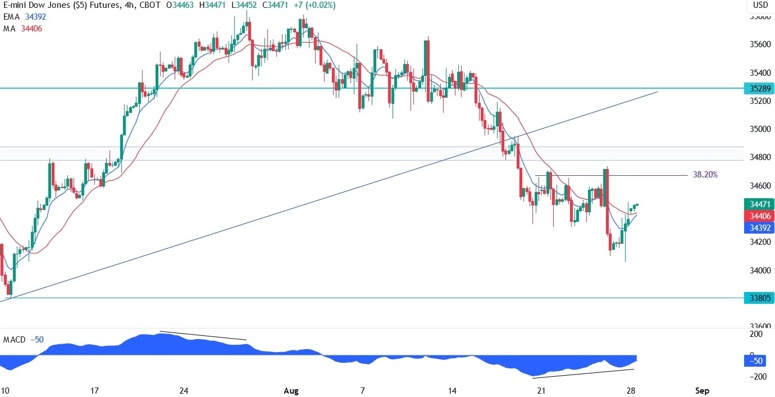
On the 4 hour chart, we can see that we have a divergence with the MACD which is generally a sign of weakening momentum often followed by pullbacks or reversals. In this case, we might see a pullback into the 38.2% Fibonacci retracement level where we have also the confluence with the previous highs and the support turned resistance. This is where we can expect the sellers to pile in with a defined risk above the level to target the 33805 support. The buyers, on the other hand, will need the price to break above the resistance to switch the bias from bearish to bullish and start targeting a new high.
📊QUICK FUNDAMENTAL LOOK
On Wednesday, we have the US ADP report. Moving on to Thursday, we will have the US Jobless Claims and the US PCE data. Finally, we conclude the week with the US NFP and the ISM Manufacturing PMI on Friday. Although the Fed keeps all the options on the table, it’s also leaning more towards a pause in September, so we will need strong data to make the market to expect a hike at the upcoming meeting.
Caution: Trading contains elements of risk, please be careful when Making Orders, Market Recommendations are only for consideration.