Market Analysis of Gold on Friday 19 November 2021
On Thursday Gold was under pressure and closed at US$1,858.86 per ounce. The previous US initial unemployment claims data was 267,000, while the forecast was 260,000 with this week's result 268,000. This data reinforces market expectations that the Fed will raise interest rates earlier than expected. Recent US inflation data has also shown a strong performance.
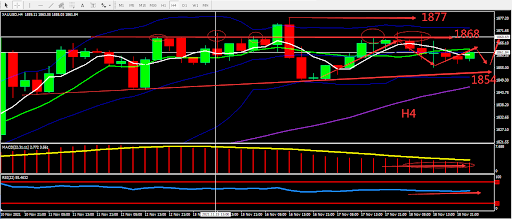
From a technical perspective, gold's daily graph maintains volatility at a high position. It looks like the impact of the data is quite small, which means the market is still strong. On the 4-hour chart, the market seems to be starting to strengthen. The BOLL is flat, MA is converging, and other indicators are relatively strong. Overall prioritize buying at low prices in the fluctuation zone. Consider the support zone and resistance zone, short term intraday trading split the bull bear point around 1868.

Resistance:1868-1877-1888
Support:1854-1849-1841
Market Analysis of Crude Oil on Friday 19 November 2021
On Friday Asia session, crude oil rose slightly, and the current price is $78.90 per barrel. The global economy has been dragged down by rising inflation, and major oil-consuming countries are trying to keep prices low. The International Energy Agency said that with the rebound in global production and the surge in shipping volumes, the current tensions are starting to ease.
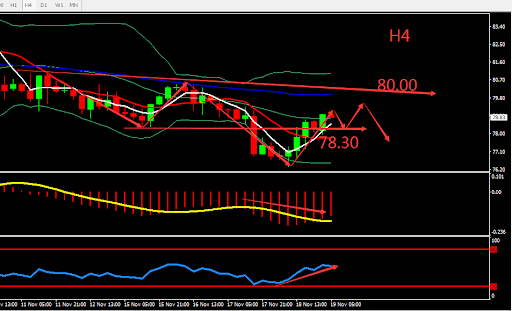
From a technical perspective, the daily graph was supported by MA60 and closed bullish. The indicator was neutral to weak. On H4 graph, the downward trend has been completed. The short-term MA form Golden Cross. MACD went downward. Crude oil is deciding the trend between bull and bear. Overall, prioritise operation within the fluctuation zone. The chart below is showing the key point and the estimated trend, the deciding point whether to buy or sell is near 78.30.

Resistance:79.40-80.00-80.70
Support:78.30-77.60-76.30
This material is from Quant Tech Limited and is being posted with permission from Quant Tech Limited. The views expressed in this material are solely those of the author and/or Quant Tech Limited and BTCDana is not endorsing or recommending any investment or trading discussed in the material. Before acting on this material, you should consider whether it is suitable for your circumstances and as necessary, seek professional advice.


