Bitcoin was stable in early trading on Tuesday, and the total market value of global digital currencies rose by about 3.20% from last week. The current stock of Bitcoin in centralized trading platforms is about 2.463 million, the lowest level in three years. The first Bitcoin ETF surpassed US$2.3 billion in two weeks of listing.
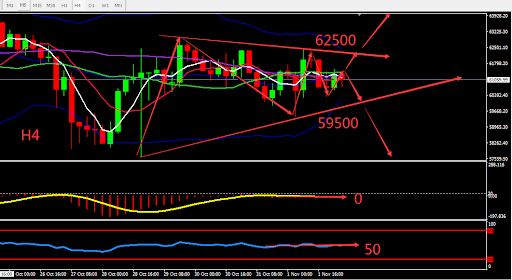
From a technical perspective, the daily graph was bearish and closed by Doji Star. Bitcoin fluctuated within a small interval. On H4 graph, BOLL narrowed. Bitcoin’s candle fluctuated within a small interval. Short-term indicator lost direction and Bitcoin seemed to be almost at a breakthrough. Overall, prioritise operation within fluctuation zone. The chart below is showing the key point and the estimated trend, the deciding point whether to buy or sell is near 59500.

Resistance:62000-62500-63700
Support:60000-59500-57500
This material is from Quant Tech Limited and is being posted with permission from Quant Tech Limited. The views expressed in this material are solely those of the author and/or Quant Tech Limited and BTCDana is not endorsing or recommending any investment or trading discussed in the material. Before acting on this material, you should consider whether it is suitable for your circumstances and as necessary, seek professional advice.


