


Market Analysis of Gold on Friday 22 October 2021
On Wednesday, gold prices strengthened slightly within the fluctuation zone. US dollar rebounds after 6 consecutive days that records a drop in price. US Treasury yields rose, and the number of claims for US unemployment benefits hit a post-epidemic low which provokes investor speculation about the timing of the Fed's rate hike. US Treasury yields rose, with the 10-year yield at 1.68%, offsetting support in gold prices on concerns about rising inflation and China's troubled real estate market.
From a technical perspective, most likely this week's gold candle will be closed bullish. Market sentiment tends to be bullish. The daily candle shows a rebound after hitting the bottom. The indicator went from bearish to neutral, and the gold candle stabilized above the MA5 and MA10. On the 4-hour chart, the gold candle is fluctuating above the middle BOLL band and the indicators remain bullish overall. Overall prioritize buying at low prices in the fluctuation zone. Consider the support zone and resistance zone, short term intraday trading split the bull bear point around 1790.
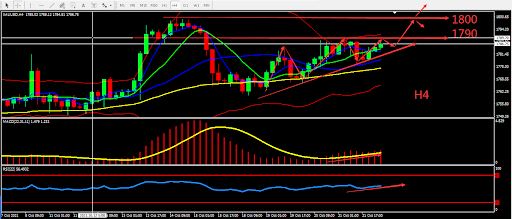
Resistance:1790-1800-1807
Support:1781-1772-1760
Market Analysis of Crude Oil on Friday 22 October 2021
On Friday Asia session, crude oil slightly fell, and the current price is at $81.94/barrel. On Thursday, due to tight supply and the global energy crisis, crude oil set a seven-year high to $83.71/barrel. However, the market predicts that the United States will welcome a warm winter which limits the increase in oil prices. Crude oil faces an intraday drop of more than 3%, and demand limited the decline. Saudi Arabia pointed out that the additional increase in crude oil will not help to curb the soaring cost of natural gas and predicts that oil demand may increase by 600,000 barrels per day.
From a technical perspective, the daily graph closed bearish. The recent market movement is relatively intense. RSI showed a sign of reversal, and the bullish momentum weakened. On H4 graph, the BOLL Band fluctuates within the interval of 83.70-80.60. Crude oil was at middle BOLL Band. MACD weakened. Overall, prioritise operation within the fluctuation zone. The chart below is showing the key point and the estimated trend, the deciding point whether to buy or sell is near 83.00.
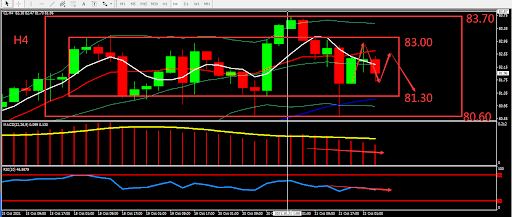
Resistance:83.00-83.70-85.00
Support:81.30-80.60-80.00
This material is from Quant Tech Limited and is being posted with permission from Quant Tech Limited. The views expressed in this material are solely those of the author and/or Quant Tech Limited and BTCDana is not endorsing or recommending any investment or trading discussed in the material. Before acting on this material, you should consider whether it is suitable for your circumstances and as necessary, seek professional advice.