Market Analysis of Gold on Tuesday 19 October 2021
On Tuesday Asian session, Gold rose slightly near 1774. On Monday, gold prices fell. The increase in the yield of US Treasuries weakened gold's appeal. Economic data from China and the United States both showed a weak momentum. The Fed's manufacturing report dealt a blow to the precious metal, pushing inflation back into the market. Gold is seen as a hedge against inflation, but also competes with the US dollar in a safe-haven position. A decline in central bank stimulus measures and the prospect of a rate hike boosted government bond yields, putting pressure on gold.
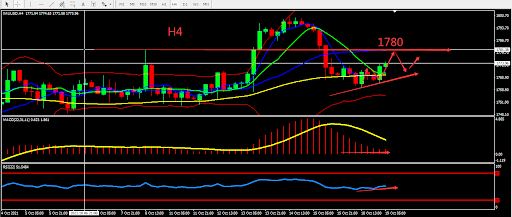
From a technical perspective, gold's daily candle closed bearish, market sentiment is still relatively neutral and tends to fluctuate. On the 4-hour chart, the BOLL band narrowed, and Gold's daily candle approach the 60 days MA. The RSI is neutral and strong. Overall operate in the fluctuation zone. Consider the support and resistance zones, short term intraday trading split the bull bear point around 1780.

Resistance:1780-1787-1800
Support:1768-1760-1750
Market Analysis of Crude Oil on Tuesday 19 October 2021
On Monday, oil prices fell after hitting a high of $83.13/barrel, because of the decline in US industrial output in September and weak industrial data which eased demand. Market concerns about the crude oil supply gap have intensified. Global oil inventories have fallen to their lowest seasonal level in seven years. Cold temperatures in the northern hemisphere are also expected to exacerbate the oil supply gap. The focus of the statement by the major oil-producing countries is still on the risks of overproduction, increased inventories and falling prices, not on supply shortages and rising prices.
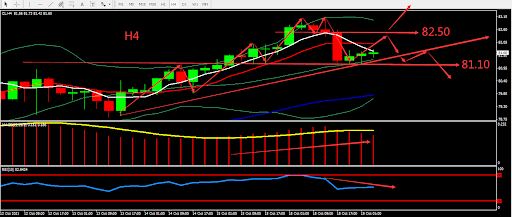
From a technical perspective, the daily graph closed bearish. RSI fell slightly and left the oversold zone at level 80. On H4 graph, crude oil weakened. MA 5 and MA 10 formed Death Cross and went downward, operating at around the middle BOLL Band. Overall, prioritise operation within the fluctuation zone. The chart below is showing the key point and the estimated trend, the deciding point whether to buy or sell is near 82.50.

Resistance:82.50-83.20-84.00
Support:81.10-80.00-79.00
This material is from Quant Tech Limited and is being posted with permission from Quant Tech Limited. The views expressed in this material are solely those of the author and/or Quant Tech Limited and BTCDana is not endorsing or recommending any investment or trading discussed in the material. Before acting on this material, you should consider whether it is suitable for your circumstances and as necessary, seek professional advice.


