Market Analysis of Gold on Monday 18 October 2021
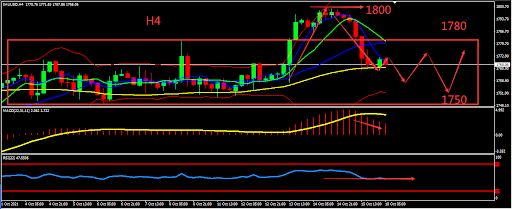
In Monday's Asian session, Gold was fluctuating at US$1,768 per ounce, and the market stabilize after experiencing an extreme drop of nearly US$30 following last week's surge and breaking through US$1,800. One of the reasons for the decline was because it failed to breakthrough the key 1800 position effectively. Second, after the United States announced strong retail sales data, US bond yields rose, and the US dollar rebounded. However, as market concerns about inflation and economic growth gradually increase, and the Fed is in no hurry to raise interest rates, the outlook for the gold market is better.
From a technical perspective, gold’s weekly candle closed with a hammer pattern and the daily candle is closed with evening star. The market’s bearish sentiment is strong. 4 hours chart shows that gold fell into the fluctuation zone, and will continue to fluctuate below 1780. The indicators are relatively neutral. Overall prioritize operations in the fluctuation zone. Consider the support and resistance zones, short term intraday trading split the bull bear point around 1780.

Resistance:1764-1780-1800
Support:1757-1750-1740
Market Analysis of Crude Oil on Monday 18 October 2021
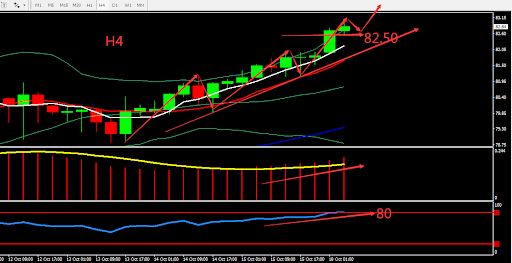
On Monday Asia session, crude oil continued to rise and current price is at US$82.85 per barrel, the highest in the past seven years is US$83.04/barrel. The relaxation of travel restrictions related to the epidemic is expected to stimulate demand for natural gas and coal shortages, leading to an increase in demand for petroleum products in the electricity market and depleting inventories. OPEC will take a gradual and phased approach to increase supply, and the market expects that there will be a supply shortage in the next few months.
From a technical perspective, the weekly graph has been going upward for a few consecutive weeks. The daily graph relied on MA5 and fluctuate upwards. There are very few bearish candles. H4 graph shows that crude oil intersects o with the upper BOLL Band and strengthened. MACD continued to increase. RSI entered level 80 which means it entered the overbought zone. Overall, prioritise Buy. The chart below is showing the key point and the estimated trend, the deciding point whether to buy or sell is near 82.50.

Resistance:83.50-84.30-85.00
Support:82.50-81.50-80.00
This material is from Quant Tech Limited and is being posted with permission from Quant Tech Limited. The views expressed in this material are solely those of the author and/or Quant Tech Limited and BTCDana is not endorsing or recommending any investment or trading discussed in the material. Before acting on this material, you should consider whether it is suitable for your circumstances and as necessary, seek professional advice.


