Market Analysis of Gold on Monday 11 October 2021
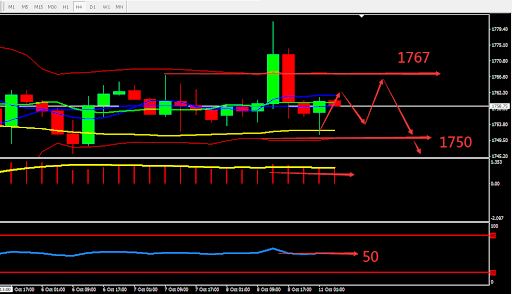
On Monday Asian session, Gold was stable at around 1759. Last Friday, gold prices rose sharply then declined, as the United States showed that the non-farm payroll (NFP data) increased by 194,000 in September, the number of new jobs in August was revised to 366,000, the unemployment rate fell to 4.8%, and average hourly wages soared. Markets believe that the Fed still has enough reasons to let the US economy free from its dependence on stimulus measures and this has led to the collapse of gold.
From a technical perspective, gold's weekly candle closed with a bearish doji candle and was relatively weak. Gold daily candle closed with gravestone pattern and market was pessimistic. Indicators are neutral but slightly bearish. In the 4-hour chart, the gold candle remains volatile around the Bollinger bands. After the breakout due to the announcement of important data, the gold price fell back to around the BOLL interval. Indicators tend to be neutral. Overall, prioritize operations within the fluctuation zone. Consider the support zone and resistance zone, short term intraday trading split the bull bear point around 1750。

Resistance:1763-1767-1776
Support:1750-1745-1737
Market Analysis of Crude Oil on Monday 11 October 2021
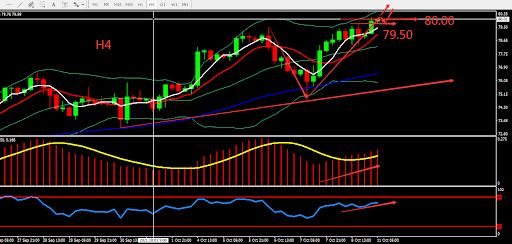
On Monday, crude oil continued its bullish trend since last week, hitting a seven-year high in early trading to US$80.11 per barrel. The price of oil rose fiercely last week, with a cumulative increase of about 4% last week. Global energy is tight. OPEC+ oil-producing countries still maintain tight supply, promoting the rise in oil prices. The global natural gas shortage has boosted oil demand for power generation and heating. At the same time, the US government said it was monitoring the energy market but did not announce immediate action to lower oil prices, further supporting the oil market.
From a technical perspective, the weekly graph closed by five consecutive bullish candles. The bullish momentum was strong. On daily graph, crude oil continuously set new short-term high, and the bullish trend has been completed. On H4 graph, it formed V pattern reversal and continue to increase. MA formed Golden Cross, MACD is bullish. Overall, prioritise Buy. The chart below is showing the key point and the estimated trend, the deciding point whether to buy or sell is near 79.50.

Resistance:79.50-80.80-81.60
Support:79.50-79.00-78.30
This material is from Quant Tech Limited and is being posted with permission from Quant Tech Limited. The views expressed in this material are solely those of the author and/or Quant Tech Limited and BTCDana is not endorsing or recommending any investment or trading discussed in the material. Before acting on this material, you should consider whether it is suitable for your circumstances and as necessary, seek professional advice.


