Market Analysis of Gold on Friday 1 October 2021
On Thursday, gold prices rose sharply. The US dollar skyrocketed and then weakened as the number of people claiming unemployment benefits in the United States in the week of September 25 was 362,000 people (higher than the expected 330,000 people and the previous value of 351,000 people), an increase for the third week in a row. This may reflect deteriorating US labor market conditions and high volatility in employment data, as well as leading to uncertainty about the Fed's debt-buying cuts. The recent drop in gold prices was driven by the Fed's expectations that it will soon begin to reduce its support for the economy.
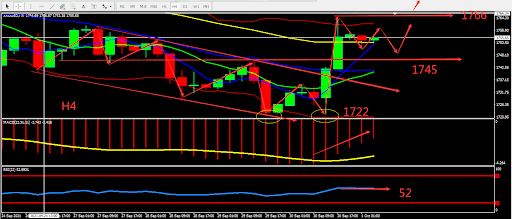
From a technical perspective, the daily gold candle closed with a large bullish candle, forming an engulfing pattern. However, the downward trend has not changed, and the indicators are still relatively bearish. The 4 hours chart is forming a double bottom pattern structure breaking through the middle BOLL band. The lower part of the MA line forms a golden cross and the RSI is above 50. Overall prioritize operations in the fluctuation zone. Consider the support zone and resistance zone, short term intraday trading split the bull bear point around 1745.

Resistance:1760-1766-1776
Support:1750-1745-1735
Market Analysis of Crude Oil on Friday 1 October 2021
On Friday Asian session, oil price hovered around 74.60, a cumulative increase of 9.7% this month, the largest monthly increase since June. Yesterday major energy consuming company in Asia ordered the country’s largest state-owned energy companies to ensure supply this winter at all costs, and the White House reiterated its concerns about price increases. It offset the price pressure caused by the unexpected rise in US crude oil inventories and the strengthening of the US dollar.
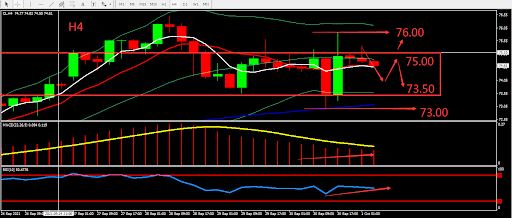
From a technical perspective, the daily graph on Thursday was closed by Doji Star. The sells and buys on the last day of September was balanced. The monthly graph remained strong. On H4 graph, crude oil moved around middle BOLL band. MACD shrunk, the indicators were neutral but slightly bullish. Overall, prioritise operation within the fluctuation zone. The chart below is showing the key point and the estimated trend, the deciding point whether to buy or sell is near 75.00.

Resistance:75.00-76.00-76.60
Support:74.30-73.50-72.30
This material is from Quant Tech Limited and is being posted with permission from Quant Tech Limited. The views expressed in this material are solely those of the author and/or Quant Tech Limited and BTCDana is not endorsing or recommending any investment or trading discussed in the material. Before acting on this material, you should consider whether it is suitable for your circumstances and as necessary, seek professional advice.


