Market Analysis of Gold on Thursday 30 September 2021
On Wednesday, gold fell sharply, boosted by forecasts of a reduction in asset purchases by the Fed before the end of the year and a possible rate hike by the end of 2022. The US index continued to climb and hit a high of 94.43. Global market risk sentiment warmed, European and American stock markets also rebounded. However, as US Treasury yields continue to rise, market concerns about inflation are heating up. Concerns about the global energy crisis will also trigger a slowdown in economic recovery, causing the rebound in risk assets such as the stock market to be limited.
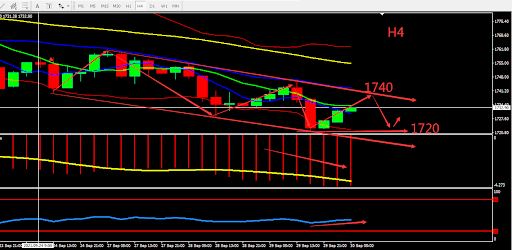
From a technical perspective, gold's daily candle closed bearish for 3 days in a row and formed a ladder bottom. Overall indicator show bearish signs. The 4-hour chart shows a downward trend, watch the movement near the 1740 point. MA forms Death Cross and bearish divergence. MACD volume is strengthening downwards. Overall prioritize selling at high prices in the fluctuation zone. Consider the support zone and resistance zone, short term intraday trading split the bull bear point around 1740.

Resistance:1740-1746-1760
Support:1728-1720-1700
Market Analysis of Crude Oil on Thursday 30 September 2021
On Thursday Asia session, crude oil fluctuated around 74.50. Oil price fell on Wednesday following the sharp rise in the US dollar. The EIA inventory report shows that crude oil unexpectedly increased by 4.578 million barrels, which is expected to decrease by 2.15 million barrels. At the same time, US crude oil increased by 500,000 barrels per day, causing oil prices to be under pressure. The global epidemic continues to increase, and some regions are facing fuel shortages. OPEC Secretary-General stated that gradually increasing production is to solve the problem of rising oil demand and prevent oversupply.
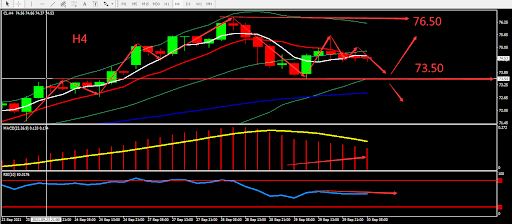
From a technical perspective, the daily candle closed by Doji Star after forming hammer pattern on high position. There was a sign of peaking in a short-term. Pay attention to level 76.50. On H4 graph, BOLL was flat. The candle was interspersed between MA5 and MA10. The indicators were neutral. Overall, prioritise Sell within the fluctuation. Open positions when there's a breakthrough. The chart below is showing the key point and the estimated trend, the deciding point whether to buy or sell is near 73.50.

Resistance:75.00-75.60-76.50
Support:74.20-73.50-72.30
This material is from Quant Tech Limited and is being posted with permission from Quant Tech Limited. The views expressed in this material are solely those of the author and/or Quant Tech Limited and BTCDana is not endorsing or recommending any investment or trading discussed in the material. Before acting on this material, you should consider whether it is suitable for your circumstances and as necessary, seek professional advice.


