




Why Every Investor Should Master RONA: A Quick Overview
When an investor wants to evaluate a company's ability to generate profits from its use of resources, they generally look at ROE; therefore, ROE has been extensively reported, is readily available, and has a long history of use as a metric for evaluating the profitability of companies. However, financial leverage can distort the ROE.
For example, if a company takes on too much debt, its ROE may be artificially inflated, but it will not necessarily increase its profitability or productive efficiency. As a result, most traditional investors will not be willing to take on this risk.
RONA, or Return on Net Assets, is an alternative measurement, in that RONA measures the efficiency of a company's use of its core operating assets (i.e., fixed assets and net working capital in generating net income; therefore, it ignores non-operating income and the effects of excessive borrowing, to accurately reflect what is occurring operationally inside the company.
Companies like Apple and Microsoft continue to report strong RONA metrics, and knowing why enables you to have an actual advantage over other companies that are using financial engineering to drive their growth.
This guide will provide you with everything you need to know about calculating RONA, finding the required inputs, benchmarking RONA against your competitors, comparing RONA with ROE, and using RONA as an actionable trading signal.
What Is RONA? A Featured Snapshot
RONA = Net Income / (Fixed Assets + Net Working Capital)
RONA quantifies the returns from a company's physical assets used in their normal operations, leaving out the effects of debt and other irregular financial cost events. The return at equity level is determined by dividing net profits by total shareholder equity and has the ability to be increased when an increase in liabilities is experienced; while returns based on physical and operational foundations are relatively stable.
ROE vs RONA at a glance
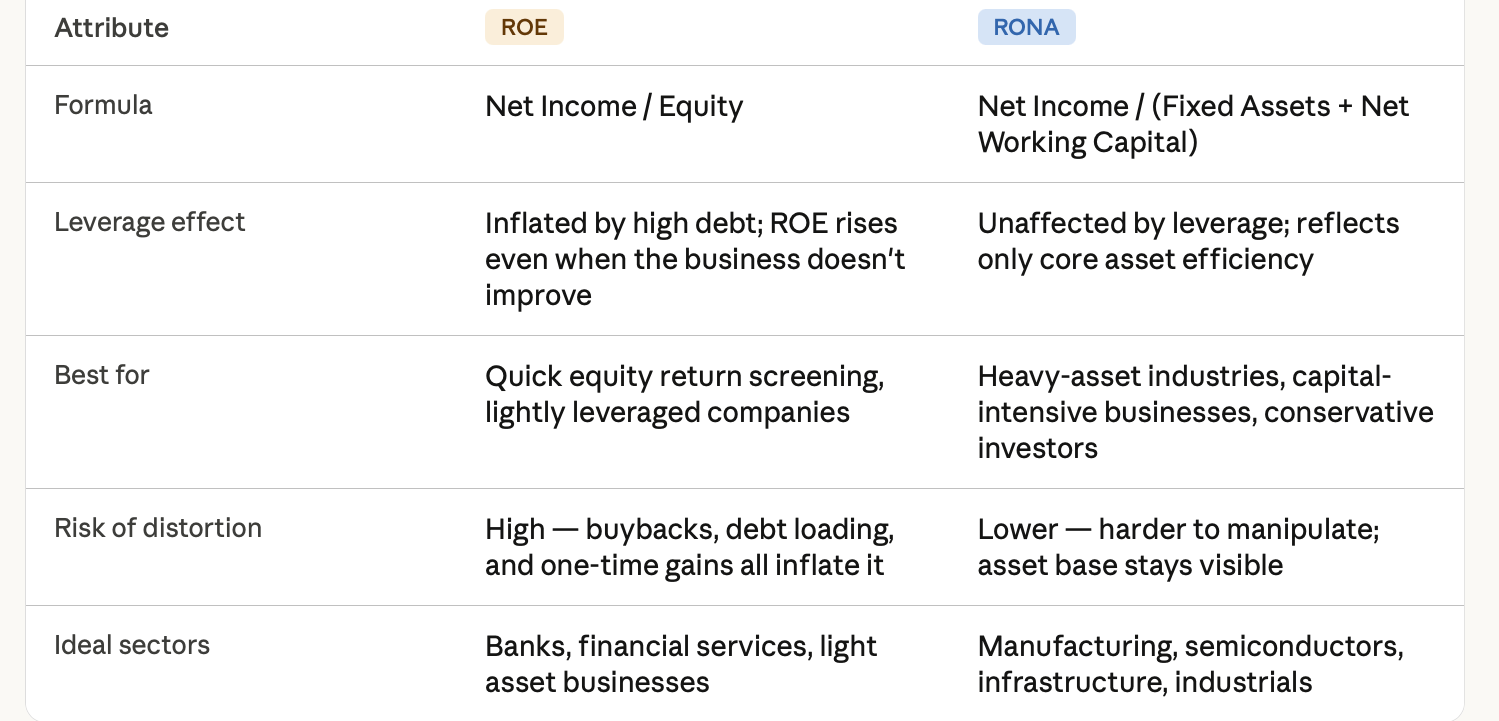
RONA is especially valuable in manufacturing, semiconductors, and any capital-intensive sector where asset efficiency is the real driver of competitive advantage.
RONA Basics: Understanding Net Assets Return
Once you know what each part of the RONA formula means, the formula is fairly simple.
Net Income is the net amount of money a business earns after all operating costs, interest, and taxes are taken into consideration. This amount is found at the end of the income statement, which is why Net Income is sometimes referred to as the "bottom line."
Fixed Assets are the long-term physical infrastructure of a business, usually represented by the company's fixed assets on its balance sheet. The fixed assets of a business include factories, equipment, servers, and vehicles used for the production and delivery of products and/or services.
Net Working Capital is equal to the total of a company's current assets minus its total current liabilities; it represents the liquidity necessary for a business to conduct day-to-day operations, including inventory, receivables, and cash available to meet short-term obligations.
Taking all three components together results in a ratio that represents how many dollars a company generates in profit for every dollar invested in its core operating engine.
For example, the RONA for a hypothetical small bakery that invests $1,000 in fixed assets, holds $200 in current assets and has $240 in net income for the year, would be $240 / ($1,000 + $200) = 20%, suggesting it is a good operating model for a small business. Now extrapolate that same thought process out to Apple.
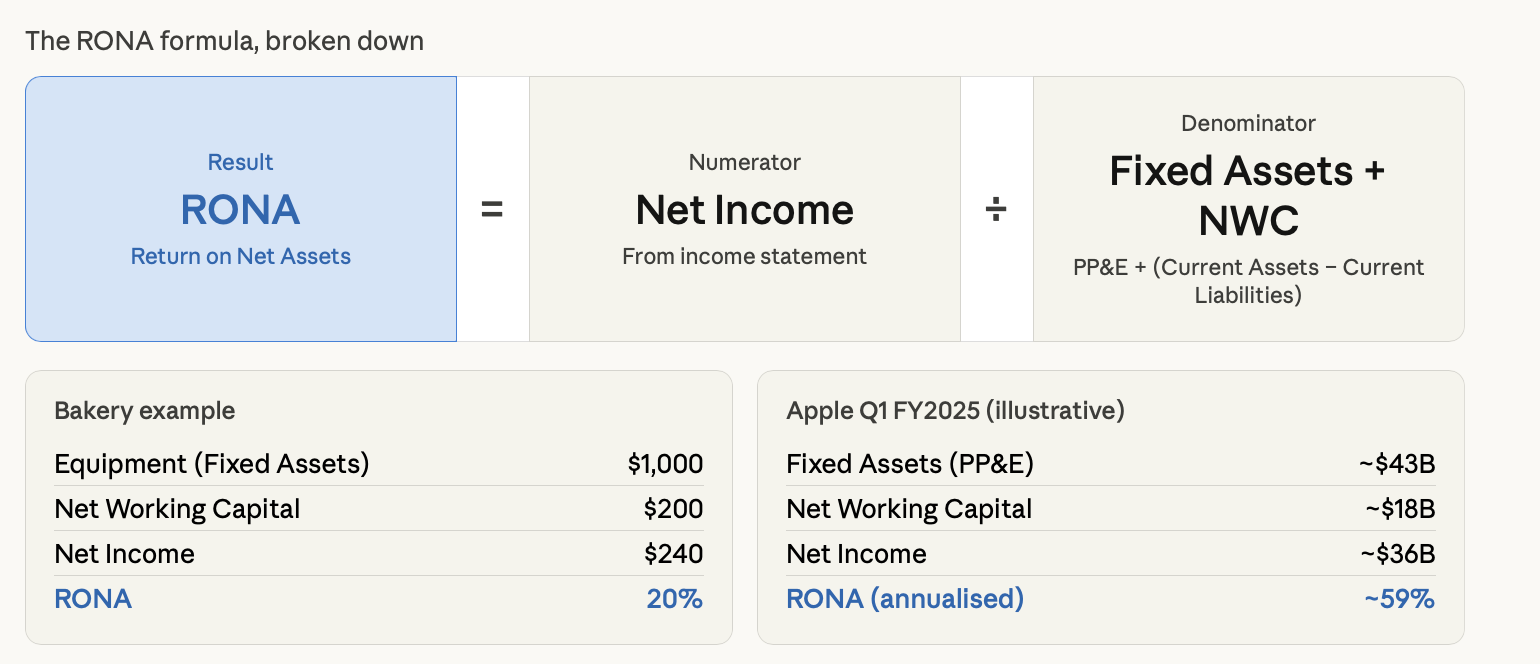
Apple's numbers look extraordinary because the company squeezes enormous profits out of a relatively lean asset base for its scale, a hallmark of world-class asset efficiency.
How to Calculate RONA from a Company's Financial Statements
The formula is only one aspect of investing; the struggle for most new investors can be where to find the numbers that will go into that formula. To help those who are new to investing, here's a step-by-step process that can be applied to any public company:
Step 1 - Locate & Open Up the Balance Sheet: The balance sheet has all of the information to figure out both fixed assets and the data required to calculate Net Working Capital. All quarterly and annual reports for a public company can be easily found on the investor relations pages of each company's home page.
Step 2 - Locate Fixed Assets: You want the net balance, which is after accumulated depreciation. Some companies separate Property, Plant & Equipment into categories such as Buildings, Machinery or Leasehold Improvements. When they do that, you will be required to add those figures together manually. You can also look for a total line where all of the listed geographies will be added up.
Step 3 - Calculate Net Working Capital: This is done by taking total current assets and subtracting total current liabilities. If the result is a positive number, it indicates that the company has a good amount of liquidity that it can access quickly. However, a negative result is not always a bad thing in all industries. Keep this in mind as you continue doing your research.
Step 4 - Go to the Income Statement and locate Net Income: You want to use the net income available for common stocks, not Operating Income or EBITDA, because both of those forms of Net Income are calculated without consideration of interest or taxes, which RONA does.
Anything in the form of a short-term financial investment, goodwill or deferred tax asset should not be used in your calculation, as they are considered non-operating or intangible assets that would distort the accurate calculation of what RONA is measuring. Use only operating assets to conduct your evaluation.
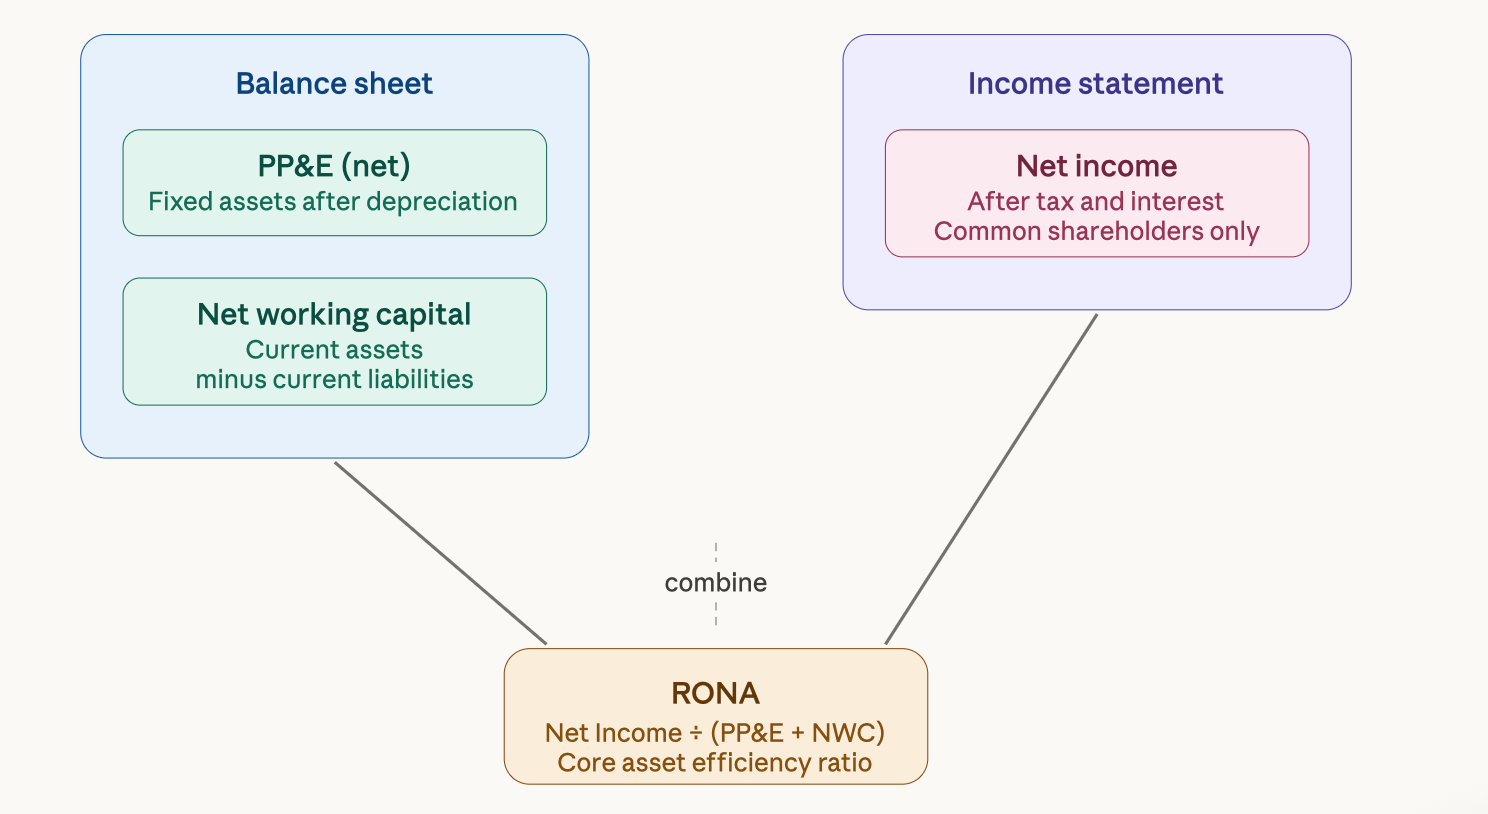
Once you've assembled those three numbers, the calculation takes about 30 seconds. The harder skill is making sure you're using the right version of each figure and excluding items that don't belong.
RONA Benchmarks: How to Tell If a Company Is Efficient
A RONA figure standing alone does not provide much insight into the company. To get an accurate understanding, the RONA must be viewed in a contextual sense; however, large generality does exist across the various industries and economic cycles.
Generally speaking, RONA's above 20% are considered excellent. Companies producing these kinds of returns have a solid amount of income being derived from operating assets, and their management team is successful at deploying capital. Apple and Microsoft have consistently produced RONA figures in excess of 20%
RONA's in the range of 10% to 20% represent a solid RONA but could also mean that either the company could improve how it is operating its assets or that the market and/or economy has created some type of headwind.
Any company with an RONA below 10% needs to be evaluated more closely than those with an RONA above 10%. In a capital-intensive sector, a company with an RONA that falls below 10% may indicate that they have invested too much money into its assets compared to the income and revenue that those assets generate. In a lighter asset sector, a company with an RONA below 10% may be dealing with margin compression or operational inefficiency.
Although the RONA figures listed above provide some type of frame of reference for measuring RONA, these figures must always be measured in the context of their industry.
For example, a semiconductor foundry with a RONA of 12% may actually indicate that they are doing quite well when considering the capital intensity of the production of semiconductors. A SaaS provider with a RONA of 12% could indicate that the SaaS provider is doing significantly worse than the majority of their peers, who have very few fixed assets that are necessary to generate revenue.
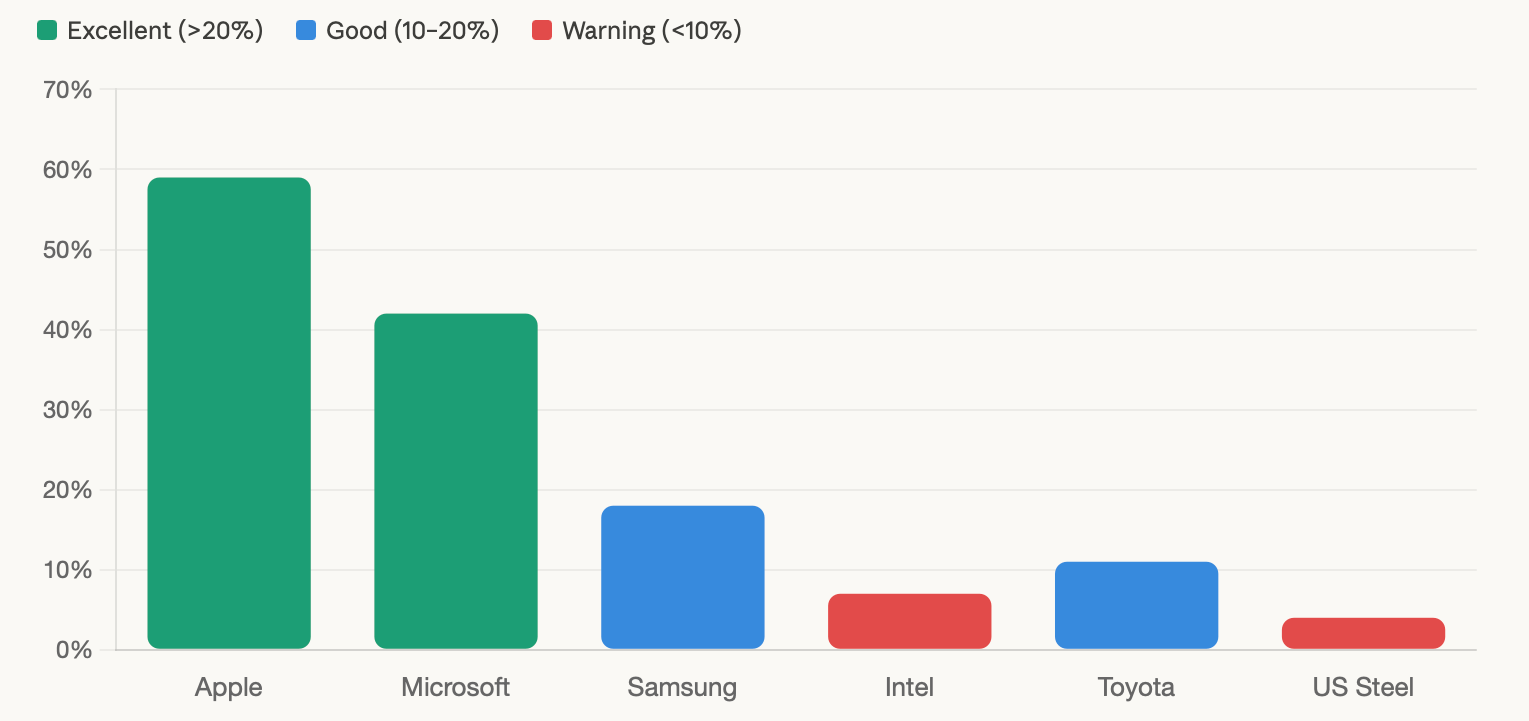
Looking at the chart, the gap between tech giants and traditional heavy-asset industries like steel is stark. That's not purely an indictment of those industries; it reflects the vastly different asset bases required to compete. What you're looking for when comparing companies is whether a given firm's RONA is above or below its closest sector peers, and whether it's trending up or down over time.
RONA vs ROE: Breaking the ROE Obsession
For many years now, ROE has been the go-to measure of efficiency in equities. While it is a measure that must be considered when investing in stocks, looking solely at ROE as the ultimate measure of efficiency can put you in a precarious position, particularly when a company is managing the engineering of its balance sheet instead of actually improving the operating of its business.
ROE is distorted by leverage. If both Company A and Company B have the same $10 million of net income, Company A's ROE is 10% (with $100 million of equity and no debt), while Company B's ROE is 20% with $50 million of equity and $50 million of debt. At a very high level, the fact that Company B's ROE is so much higher shows that Company B is twice as efficient at running its business as Company A. However, Company B's ROE only reflects how it finances itself, not how well it runs its operations.
As you can imagine, if both Company A and Company B have the same amount of fixed assets and working capital, their RONA will be the same, irrespective of the amount of debt either company has on its balance sheet, because debt is not included in the denominator of RONA. RONA measures how effectively a company uses its assets, which is not influenced by the amount of debt a company has on its balance sheet.
For conservative investors trading CFDs or building long-term positions in capital-intensive businesses, RONA provides a cleaner measure of asset efficiency. Investors are not unintentionally rewarding a company's leverage decisions when interest rates rise and create significant risk for the company.
A bakery can use either savings or debt to purchase an oven. Clearly, the two bakeries will report very different ROEs. But if both bakeries' ovens generate the same revenue, they will report the same RONA. This is the point.
RONA in Heavy Asset Industries: A Stock Picking Tool
RONA earns the bulk of its merit in capital-intensive industries. Manufacturing facilities, semiconductor fabrication plants, ocean carrier companies, electric companies, and infrastructure-related companies are all massive fixed asset industries. A minor modification toward improved application of those fixed assets significantly enhances RONA and generally allows for stock price appreciation prior to analysts' uplifts.
Furthermore, during inflationary environments where input costs are rising, businesses with high RONA are more likely to weather that storm. They already have efficient use of their fixed assets, providing them a margin by which to absorb cost escalations without negatively affecting their profit margin. A business that generates an 8% RONA has less margin cushion than an enterprise operating at a 22% RONA.
For example, two semiconductor fabricators are both investing significantly in fabrication capacity. Yet, one is producing considerably higher RONA on currently deployed fixed assets. The difference in efficiency of these two companies compounds over time.
The more efficient company uses its cash flow to reinvest from a position of relative strength, whereas the less efficient fabricator continues to grow and acquire fixed assets without generating sufficient return on their current fixed assets.
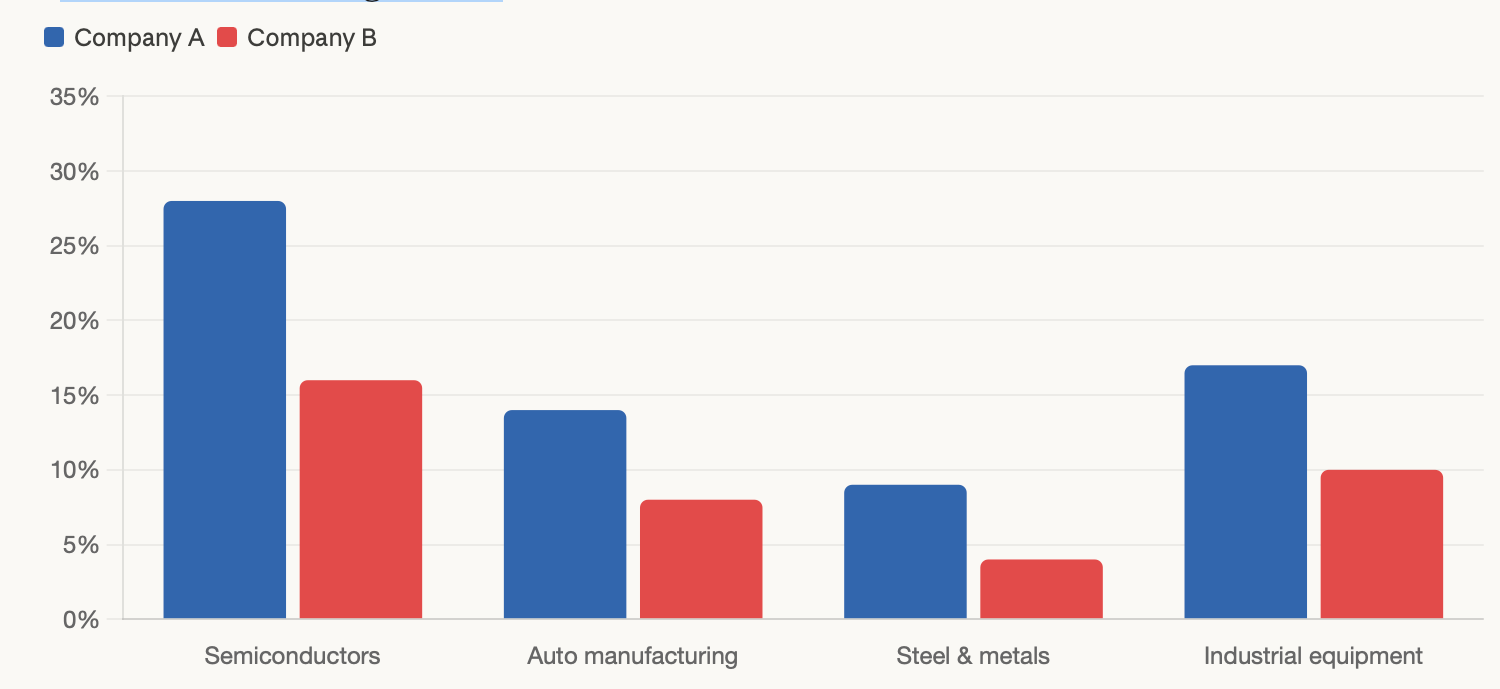
In every sector of business, Company A is a consistently superior performer. When it comes to asset-heavy industries, there is almost no way that this type of long-term RONA difference will happen by chance. It usually reflects superior management practices, processes and technologies that compound over time to create large differences in market valuations.
Turning RONA into Buy and Sell Signals
A single multiple of RONA gives an instant view of how the business is performing as of now. However, if you want to gain a significant trading advantage, you need to analyse RONA over time to see what is happening with RONA trends.
Understanding the RONA inflexion point is the key to doing this! When RONA has been decreasing for two or more years and starts to recover, it usually signals solid progress in operational effectiveness that the market hasn't taken into account.
This will typically indicate that asset efficiency is improving and that profits are beginning to exceed the growth of the company's asset base, and that management has begun to turn around the business. Therefore, for a mid-term trader patiently waiting for 6-12 months, the RONA inflexion point will usually be a strong buy signal to invest.
On the other hand, an obvious red flag is when the stock price increases while RONA continues to go down. The stock price may have future growth anticipated; however, the company's current level of asset efficiency does not support this current stock price.
Once you have developed an understanding of how RONA can help you as a trader, you can then use BTCDANA's demo account to practice tracking RONA trends for three-year periods for companies within industries you follow.
Additionally, with each company, you can note when the inflexion point in RONA occurred, and how the stock price acted over this initial period. Over time, you will learn to identify which companies experience RONA traction and subsequently see their stock value increase substantially.
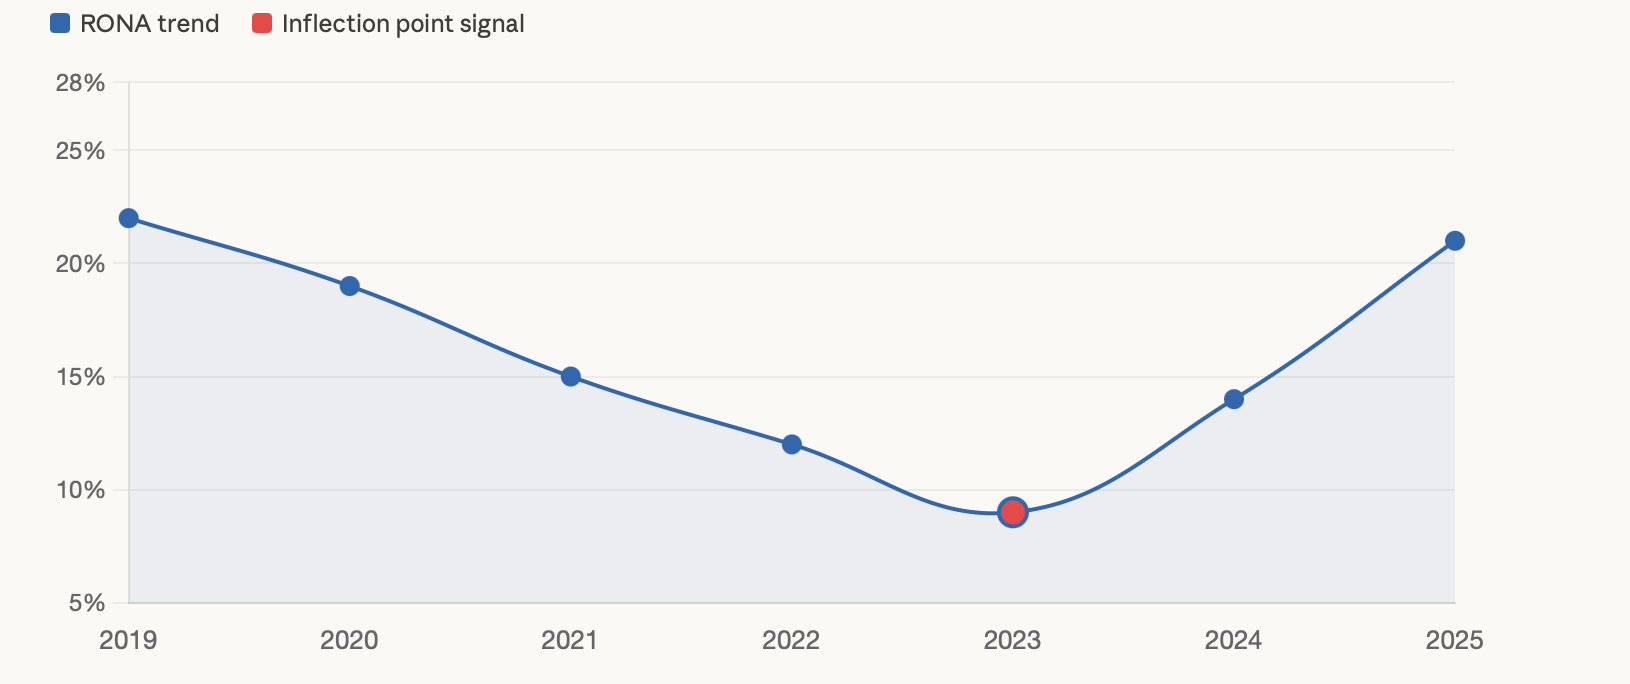
The highlighted inflexion point in 2023 represents exactly the kind of signal you want to catch early. By the time most analysts publish their upgraded outlooks in 2024 and 2025, the RONA trend has already confirmed the turnaround. Disciplined RONA monitoring puts you ahead of that curve.
How to Improve RONA: What Management Should Be Doing
As an investor, understanding how RONA improves helps you evaluate whether a company's strategy is actually working. There are two levers: grow net income, or shrink the asset base required to generate it. The most impressive RONA improvements come from doing both simultaneously.
On the income side, companies can grow RONA by expanding revenue without proportionally expanding their asset base, by cutting operating costs that erode net income, or by improving pricing power. Apple is a case study in pricing power driving RONA: its product mix has shifted toward higher-margin services and premium hardware while its asset base has remained relatively lean.
On the asset side, companies can sell idle or underutilised equipment, improve fixed asset turnover rates by running facilities for more hours or at higher capacity, and tighten inventory management to reduce the working capital absorbed by excess stock. Tesla's push to optimise factory utilisation and reduce inventory cycle times has been a visible driver of its RONA improvement over recent years.
Better receivables management also lifts RONA. Every day of sales outstanding that a company eliminates from its receivables collection cycle reduces net working capital, shrinking the denominator and pushing RONA higher without touching profitability at all. That's the kind of unglamorous operational improvement that often goes unreported but shows up clearly in the ratio.
Common RONA Mistakes and How to Avoid Them
RONA alone is not sufficient to determine if a company is a good investment. The RONA reporting number has many misleading characteristics unless it receives context.
One-time asset disposals have a significant impact on RONA. When a company sells an asset such as a factory or piece of equipment, there are two effects on the financial results. First, there is a reduction in the fixed asset base; secondly, there will also be an increase in net income if the company realises a gain from the sale. While the RONA will have a dramatic increase, it is clear that the increase is not sustainable and should be carefully reviewed in the context of an asset sale or an extraordinary event recorded in the income statement.
Non-operating income can also inflate net income, resulting in overstated core asset productivity. For example, if a company sells an investment portfolio for a large gain, it will have a tremendous RONA for this quarter. If this component is removed from the totals, then the RONA will reflect an accurate value not subject to any one-time gains. Normalised or operating net income should be used when determining the RONA.
Working capital fluctuations caused by short-term activities can distort RONA. If the company collected a significant amount of outstanding receivables at the end of a quarter, the resulting amount of net working capital immediately preceding quarter-end will be low and the result: the denominator of the RONA calculation will be relatively small, resulting in a higher RONA value.
As well, during an increase in inventory leading up to a seasonal business period, this will cause a spike in working capital, depressing the calculated value of RONA. Collectively, neither example above indicates the true performance of the company and its business unit.
When comparing RONA among companies based on their industry classification, be cautious. When varying the methods of depreciation, the resultant amount of net PP&E will be significantly different, and thus, the mechanical computation of RONA will produce significantly different results. In general, companies with older depreciable assets will have a smaller amount of PP&E when compared to companies with more recent depreciational history.
Older PP&E represents a much larger quantity of depreciated dollars relative to older depreciating assets, which would have an abundance of outdated equipment compared to a company with more recently depreciated equipment. To assess the company based on RONA, consider the long-term trends of capital expenditures as well as the age of the capital expenditures and attempt to obtain other information regarding RONA.
FAQ: RONA Explained for Investors
What is RONA? RONA stands for Return on Net Assets. It measures how much net profit a company generates relative to its fixed assets and net working capital.
How is RONA different from ROE? ROE uses shareholder equity in the denominator, which means it rises when a company takes on more debt. RONA uses operating assets instead, so it can't be inflated by leverage. It gives you a cleaner picture of how efficiently the core business is running.
Does a high RONA always mean good performance? Not necessarily. A one-time asset sale or unusual income item can spike RONA in a way that's misleading. Always check whether the figure is sustainable and look at trends over at least three years rather than a single quarter.
How do I quickly calculate RONA from financial statements? Pull net PP&E from the balance sheet, calculate net working capital as current assets minus current liabilities, then divide net income (from the income statement) by the sum of those two figures. Exclude goodwill, deferred tax assets, and short-term investments.
Which industries benefit most from RONA analysis? Manufacturing, semiconductors, utilities, industrials, and any other sector where large fixed asset bases drive competitive advantage. RONA is less useful for financial services or asset-light technology companies, where a different framework fits better.
How do I use RONA to pick stocks? Track RONA over multiple years and look for inflexion points where a declining trend begins to reverse. Compare RONA figures against sector peers rather than absolute benchmarks. Use BTCDANA's financial tools to screen and monitor RONA trends alongside price data to identify potential entry points before broader market recognition.
Ready to put RONA analysis into practice without risking real capital? Open a BTCDANA simulation account today and start screening companies by RONA trends using our built-in financial analysis tools, because the best trades start with the right numbers, not guesswork.