Market Analysis of Gold on Monday 27 September 2021
On Monday Asian session, Gold strengthened slightly and is currently trading around 1760. Due to the high-risk aversion sentiment in the market, and the United States is proposing a new stimulus bill, the Democrats want to "combine" voting on the 3.5 trillion US stimulus bill and infrastructure bill to increase risk. But the strengthening of the US dollar and US Treasury yields have limited the rise in gold prices. Soon, international politics will welcome two major elections in Germany and Japan.
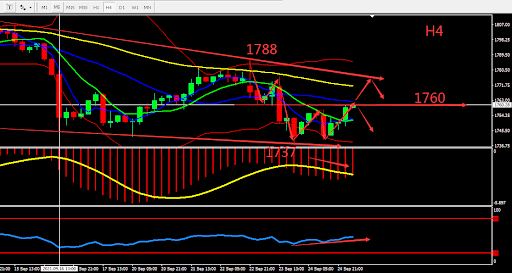
From a technical perspective, the gold weekly candle closed bearish for 3 weeks in a row and the gold daily candle closed bullish after forming the Evening star pattern. Currently, it looks like the market is still correcting, and has yet to confirm a reversal. The 4 hours chart shows that gold forms a double bottom pattern, but is still below the middle BOLL band, and moving averages are showing signs of stabilization. Overall, prioritize operation in the fluctuation zone. Consider the support zone and resistance zone, short term intraday trading split the bull bear point around 1760.

Resistance:1767-1776-1788
Support:1755-1748-1737
Market Analysis of Crude Oil on Monday 27 September 2021
On Monday Asia session, crude oil quickly broke through level 75, reaching the highest point $75.18 per barrel. Oil prices have risen to highs in the past three consecutive years, as the global energy crisis will boost demand for crude oil, and inventories from the United States to Asia are falling. The Fed also recently announced their plan to reduce their debt purchases, thus confirming their optimistic attitude towards the economy, which are the factors behind favourable oil prices.
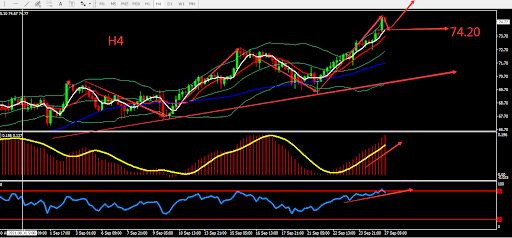
From a technical perspective, the price of crude oil on the weekly graph will continue rise. Since the price of crude oil increased from the low position at 61.73, there hasn't been much correction. The daily graph closed by four consecutive bullish candles. The trend formed upper ladder. The BOLL reversed upwards and there were signs of acceleration. On H4 graph, the price of oil relied on MA upward movement, indicators showed bullish signal. Overall, prioritise Buy during correction. The chart below is showing the key point and the estimated trend, the deciding point whether to buy or sell is near 74.20.

Resistance:75.70-76.40-77.00
Support:74.20-73.50-72.70
This material is from Quant Tech Limited and is being posted with permission from Quant Tech Limited. The views expressed in this material are solely those of the author and/or Quant Tech Limited and BTCDana is not endorsing or recommending any investment or trading discussed in the material. Before acting on this material, you should consider whether it is suitable for your circumstances and as necessary, seek professional advice.


