Market Analysis of Gold on Monday 6 September 2021
In early Monday trading, gold prices remained near their highest point since July. The non-farm employment report released by the United States on Friday was unexpectedly disappointing with 235,000 new employment and the unemployment rate dropping to 5.2%. The lower-than-expected data weighed on the US dollar, and boosted yields of precious metals such as gold and silver. US Treasury yields also strengthened. In the opinion of Fed Chair Powell earlier, we need to see stronger employment data before we can start to scale back debt purchase. This has a bullish effect on gold.
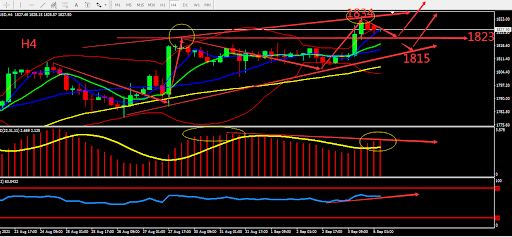
From a technical perspective, gold's weekly candle closed bullish for the 4th week in a row. The daily candle forms a bullish ladder and is under pressure from 1834. The indicators are bullish overall, and the 4-hour moving average diverges upwards. MACD is showing signs of divergence and is relatively bullish. Overall, it seems like gold should undergo correction first, therefore prioritize Buy after gold undergoes correction. Consider the support zone and resistance zone, the deciding point whether to buy or sell is near 1823.

Resistance:1834-1844-1855
Support:1823-1815-1807
Market Analysis of Crude Oil on Monday 6th September 2021
On Monday Asia session, crude oil fluctuated around 68.40, and oil price fell last Friday. The previous employment report released by the United States was worse than expected, indicating that the economic recovery is unstable, which may mean that fuel demand will slow down as the epidemic worsens again. After Hurricane Ida reduced production in the U.S. Gulf of Mexico, the market is worried that U.S. oil supply would still be limited, which limited the drop-in oil prices. Due to US Labour Day on Monday, US crude oil inventory data will be postponed by one day.
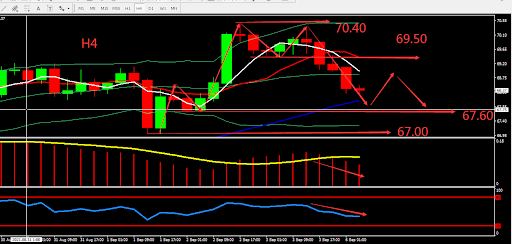
From a technical perspective, crude oil closed by Doji Star on the high position last week, beware of a sudden drop. The daily candle was above the middle Bollinger band and was under resistance of MA60 at around 70.50. On H4 graph, MA and MA10 is forming a Death Cross, and moved below the middle Bollinger band. Overall, prioritise Sell on the high position within the fluctuation zone. The chart below is showing the key point and the estimated trend, the deciding point whether to buy or sell is near 67.60.

Resistance:69.00-69.50-70.40
Support:67.60-67.00-66.00
This material is from Quant Tech Limited and is being posted with permission from Quant Tech Limited. The views expressed in this material are solely those of the author and/or Quant Tech Limited and BTCDana is not endorsing or recommending any investment or trading discussed in the material. Before acting on this material, you should consider whether it is suitable for your circumstances and as necessary, seek professional advice.


