Market Analysis of Gold on Tuesday 24 August 2021
On Monday, gold prices broke the key $1,800 mark. The weakening of the US dollar encourages the strengthening of gold prices. The rising number of coronavirus cases has fuelled expectations that the Fed will delay reducing economic measures. The initial value of the Markit service industry PMI in the United States in August was 55.2, the lowest since last December. The initial value of manufacturing PMI fell to 61.2 from 63.4 in July. Raw material shortages, labour shortages and an increase in cases of the Delta variant lowers the activity in US company.
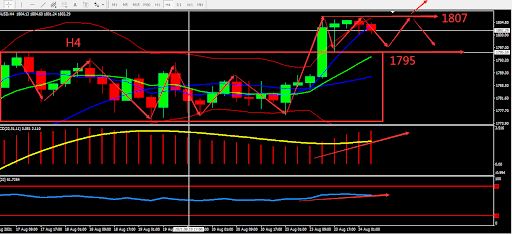
From a technical perspective, gold's daily candle is steady around the middle band of BOLL and was under the pressure of the 60-day moving average. Its strengthening momentum is diminishing. The 4 hours chart shows a breakout, 1795 being the signal breakout point and all indicators show bullish signs. Overall, operate primarily in the fluctuation zone. Consider the support zone and resistance zone, the deciding point whether to buy or sell is near 1800

Resistance:1807-1815-1828
Support:1795-1788-1774
Market Analysis of Crude Oil on Tuesday 24 August 2021
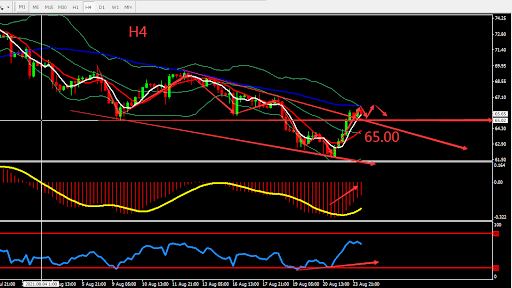
Crude oil rose sharply by 6% on Tuesday, hitting the lowest price of 61.73, the highest 65.92, and closed at 65.44. Due to the rebound in market risk sentiment and the weakening of the U.S. dollar, and the U.S. Food and Drug Administration (FDA) announced that it has fully approved Pfizer’s new corona vaccine and zero new confirmed cases in China, crude oil its ended the decline that has lasted for seven consecutive trading days.
From a technical perspective, the daily candle closed bullish and under pressure from MA10. Pay attention to the resistance at level 66. The overall indicators are still bearish. H4 graph showed that crude oil broke through the middle BOLL band and is currently under resistance from the upper band. RSI indicator turned upside. Overall, prioritise Buy on Low within the fluctuation zone. The chart below is showing the key point and the estimated trend, the deciding point whether to buy or sell is near 65.00.

Resistance:66.00-66.80-67.50
Support:65.00-64.00-62.30
This material is from Quant Tech Limited and is being posted with permission from Quant Tech Limited. The views expressed in this material are solely those of the author and/or Quant Tech Limited and BTCDana is not endorsing or recommending any investment or trading discussed in the material. Before acting on this material, you should consider whether it is suitable for your circumstances and as necessary, seek professional advice.


