


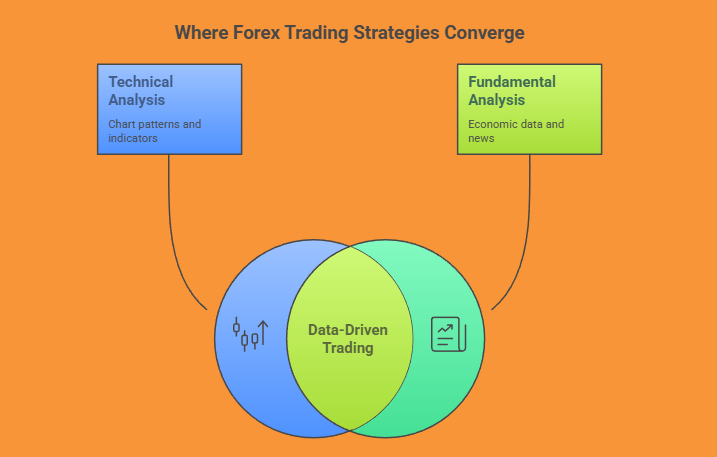
In the forex market analysis, traders can pick between technical analysis (reading charts and indicators) or fundamental analysis (studying economic and geopolitical events). Although some stick to just one, combining both gives you the best of both worlds. Think of it like having a map (fundamentals) and a compass (technical) for your trading journey.
Forex technical analysis is all about understanding price charts, spotting patterns, drawing trendlines, and using indicators to guess where things might head next. On the flip side, fundamental analysis dives into the economic factors that really affect currency values.
Instead of viewing technical and fundamental strategies as competing philosophies, the most successful traders see them as complementary tools. Hedge-fund titan Paul Tudor Jones, for instance, often uses macroeconomic insights to decide on trade direction and then relies on technical indicators like the 200-day moving average to nail down his entry points.
In this forex trading guide, we’ll explore how combining technical and fundamental analysis multiplies your strategic edge. By blending chart signals with real-world events, you’ll get a fuller view of the market and be in a better spot to make confident trades.
Technical Analysis Explained
Technical analysis is a visual, data-driven approach to forex market forecasting. It works on the idea that all known info is already factored into the market, so by looking at the price action, traders can make educated guesses about future ones.
Traders use various forex charts for beginners and experts alike, ranging from minute or tick charts for scalping, to hourly and daily charts for day trading, and weekly charts for swing trades. They analyze price action through candlestick patterns like pin bars and dojis, plus formations like head-and-shoulders or triangles that hint at breakouts or reversals.
Some key tools include:
-
Support and resistance levels: historical price zones where movement typically stalls or reverses.
-
Volume or tick volume: While forex lacks centralized volume data, tick count still provides insight into the strength of price moves.
-
Popular trading indicators forex traders use include:
-
RSI (Relative Strength Index) – identifies overbought/oversold conditions.
-
MACD (Moving Average Convergence Divergence) – detects trend momentum and crossover signals.
-
Moving Averages – smooth out price trends to highlight direction.
-
Bollinger Bands – outline volatility envelopes.
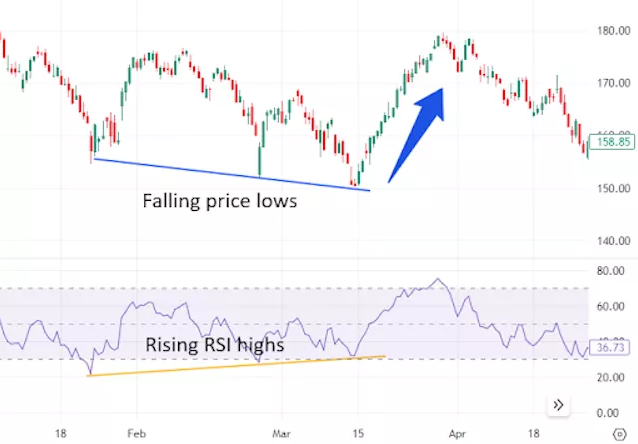
A powerful example of technical analysis is RSI divergence. In one case, the EUR/USD made a lower low, but the RSI formed a higher low—this “bullish divergence” signaled waning selling pressure and preceded a sharp reversal upward.
While forex technical analysis is great for giving real-time signals based on probabilities, its main downside is that it’s backward-looking. Sudden news events can invalidate even the most reliable chart setups. Still, when used smartly, it’s a must-have tool for every trader.
Fundamental Analysis Explained
While charts show what is happening in the market, fundamental analysis in forex helps traders understand why it’s happening. Instead of just relying on patterns or indicators, fundamental analysis zooms in on the macroeconomic and geopolitical forces that drive currency value.
At the core of economic indicators currency trading are metrics like GDP growth, inflation (CPI/PPI), interest rates, employment data (such as the U.S. Non-Farm Payroll report), and trade balances. Among these, interest rates usually have the biggest impact. Decisions made by central banks like the Federal Reserve, European Central Bank (ECB), and Bank of Japan are super important to keep an eye on. If they suddenly raise rates or change their policies, it can really shake up forex pairs.
Beyond economics, forex news trading must account for geopolitical developments like elections, wars, pandemics, or global trade tensions that shape investor sentiment. Take the 2016 Brexit vote, which caused the GBP/USD to drop to a 30-year low in just a few hours because of a big change in how the economy was viewed. Also, a better-than-expected Non-Farm Payroll (NFP) report usually boosts the U.S. dollar, while a disappointing one can lead to selling.
Fundamental analysis is great for spotting long-term currency trends and understanding the market's overall health. But it can be tricky and slow, so traders need to stay updated and be patient. Even those who focus on short-term strategies can gain from looking at fundamentals to avoid going against major market trends.
In a nutshell, using fundamental analysis in forex gives you important context and clarity, which is crucial for making smart trading choices.
Comparing Technical vs Fundamental Analysis
A meaningful forex analysis comparison reveals that both approaches serve different roles, and mixing them together gives you better insights and timing.
A classic example of why this mix is vital: a technical breakout in EUR/USD might look good until a central bank announces a dovish shift, causing the pair to crash. The chart might say “buy,” but the fundamentals scream “be careful.”
The lesson? Don’t just stick to one way of looking at things. The best analysis for forex trading comes from blending both methods.
How to Combine Both Analyses in Practice
Step-by-Step Integration:
-
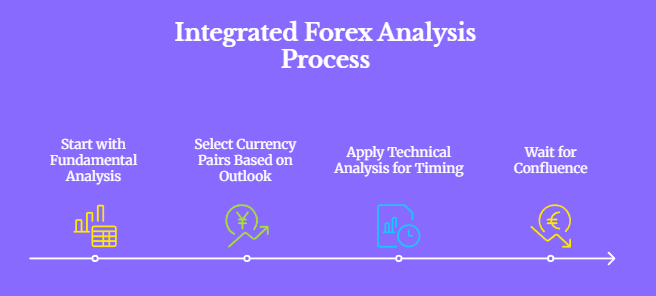
Start with Fundamental Analysis
Begin by scanning economic calendars and news feeds. Look for big events like interest rate hikes, NFP reports, or comments from central banks. This gives you a big picture view and helps you figure out which currencies are strong or weak (like being bullish on USD if the Fed is aggressive, or bearish on JPY if the BoJ is soft). -
Select Currency Pairs Based on Outlook
Once you’ve got the fundamentals sorted, choose a pair that fits, like USD/JPY in a strong USD situation, and decide if you want to go long or short. -
Apply Technical Analysis for Timing
Now, check out the charts. Mark support and resistance levels, look for candlestick patterns, and keep an eye on momentum indicators like RSI or MACD. See if the price movement backs up your fundamental view. -
Wait for Confluence
Only act when both methods agree. For example, after a strong NFP report (which is good for USD), wait for EUR/USD to break below a key support level with RSI showing downward momentum. This is what integrated forex analysis is all about. News guides you, and charts tell you when to make a move.
Real-World Example:
Picture this: the Fed catches everyone off guard with a rate hike. Suddenly, the USD looks strong. On the USD/JPY daily chart, you spot an inverted head-and-shoulders pattern popping up. You’re waiting for it to break the neckline, and the RSI is going up—perfect time to jump in long. This whole setup boosts your confidence and chances of winning.
Tools That Help:
Platforms like BTCDana, MetaTrader, and TradingView make it easier by giving you charts, economic calendars, and alerts all in one spot. Use them to set reminders for important events and then check the charts for confirmation.
Common Mistakes to Avoid:
-
Ignoring macro events while scalping.
-
Overtrading news without technical confirmation.
-
Relying solely on indicators without understanding the economic backdrop.
By combining forex trading strategies, you can cover blind spots and sharpen your skills. This synergy of forex analysis techniques leads to better trades and smarter risk control. As one analyst put it, “Winning traders rely on integrated forex analysis to trade what they see and what they know.”
Conclusion
In forex trading, you won’t find success by sticking to just one approach. The most effective forex trading strategies come from combining both technical and fundamental analysis.
To really learn forex analysis, practice is crucial. Keep a trading journal to see how economic news and chart signals worked together (or didn’t) in each trade. This habit will help you refine your own style and avoid repeating the same mistakes.
Being flexible is important. As trading psychologist Brett Steenbarger says,
“Successful traders spend as much time studying themselves and their trading as studying markets.”
Even the best analysis can miss the mark when market conditions change
Ready to put it all into practice?

-
Sign up on BTCDana.
-
Practice on the demo to refine your forex analysis.
-
Visit our BTCDana trading guide and join our platform strategy for weekly expert insights.